Download
1 / 20
200 likes | 305 Vues
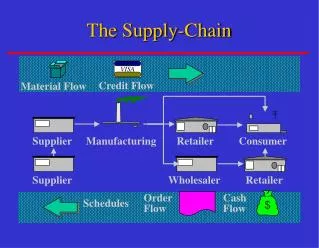
The Equity Supply Chain:. Is it the Cause of So Few Women in Management and Leadership Positions?. Richard G. Dudley. 25 th Meeting of the International System Dynamics Society. Boston - July 2007. A Pipeline Issue? (some quotes).

E N D
The Equity Supply Chain: Is it the Cause of So Few Women in Management and Leadership Positions? Richard G. Dudley 25th Meeting of the International System Dynamics Society Boston - July 2007
A Pipeline Issue? (some quotes) “… the assumption — usually unfounded — that there isn’t enough talent in the pipeline.” “qualified women in substantial numbers have been available for the academic pipeline for 20 years.” “For decades, the pat explanation was that women simply had not been in the work force long enough... A look at the pipeline suggests otherwise.” “This dearth of women leaders, both academic and administrative, is no longer a pipeline issue.”
A Simple Question: • Given that women make up 45% of the US workforce but only 16% of corporate officers and only 2% of CEOs…. • Can pipeline delays alone account for this relatively low fraction of CEO and leadership positions held by women? • In other words, are the numbers of women in these positions what we would expect… …given historical trends of women in the overall workforce and in college?
The Approach Taken: • Supply Chain (subscripted by gender): • Starting with last year in high school • Three levels of university education • Six career categories • Adjust input data so that (for ~1940 – 2005): • Proportion of female and male university students matches real world information. • Proportions of men and women in the total workforce match real world information. • Examine: • fraction of male and female workers in Senior and Leadership Positions • under different scenarios.
a pipeline delay becoming a retiring1 homemaker entering basic career from high becoming school established People in People People with Basic During Early being Established Careers Career promoted Career Path becoming a moving up retiring2 homemaker after faster retiring college established People in Post personnel College Basic recruiting L3 highly trained Careers recruiting L2 graduates graduates college entering graduates work force Model Structure 2: Early Workforce moving up
retiring retiring senior leaders personnel being People in promoted People in People with Relatively Senior Leadership Established and Responsible Positions Career Path picking Positions leadership Model Structure 3: Higher Positions
FRACTION NEEDED IN SENIOR POSITIONS FRACTION REQUIRED expected move new senior to leadership IN LEADERSHIP people needed POSITIONS expected senior retirements fraction of candidates to be recruited retiring retiring senior leaders personnel being People in promoted People in People with Relatively Senior expected Leadership Established and Responsible leadership Positions Career Path picking Positions retirement leadership fraction of senior candidates to be recruited number of new leaders needed Model Structure 3: Higher Positions <total workforce> <total workforce>
Some Background 1: Historical Trend - Workforce Composition 0.9 Approximate Composition of the Workforce by Gender 0.8 Men - accounting for women's part-time participation in the workforce 0.7 men 0.6 0.5 fraction of the workforce 0.4 women 0.3 Women - accounting for part-time participation in the workforce 0.2 But! A consistent fraction of women work part-time. So! To give the supply chain hypothesis a better chance… I will use these lower values for women’s participation in the workforce! 0.1 0 1950 1975 1998 2005 Year
Since 1980 women college students outnumber men. female male Some Background 2: Historical Trend – Fraction with College Degree Fraction of US Population Graduating from College 0.4 0.35 0.3 0.25 fraction 0.2 0.15 0.1 0.05 0 1930 1940 1950 1960 1970 1980 1990 2000 Year of Graduation
0.5 Fraction of Each Work Category Who are Female What we would expect to find if movement through the workforce is the same for men and women and differences are due solely to differences in numbers available for promotion. 0.45 0.4 fraction of workforce all basic careers 0.35 early careers 0.3 Dmnl 0.25 Expected fraction of senior management positions held by women Actual 0.2 established career path 0.15 senior workforce leaders 0.1 1940 1950 1960 1970 1980 1990 2000 2010 Time (Year)
0.5 Fraction of Each Work Category Who are Female 0.45 0.4 0.35 0.3 Dmnl 0.25 0.2 0.15 0.1 1940 1950 1960 1970 1980 1990 2000 2010 Time (Year)
An Adjustment: • Suppose we assume that the number of women “becoming homemakers” tags all women in basic careers as less suitable for promotion. • That is: Movement out of both “basic careers” is limited by the perception that women are homemakers.
0.5 0.5 Fraction of Each Work Category Who are Female Fraction of Each Work Category Who are Female 0.45 0.45 fraction of workforce 0.4 0.4 all basic careers early careers 0.35 0.35 0.3 Dmnl Dmnl 0.3 0.25 0.25 0.2 0.2 established career path 0.15 senior workforce 0.15 leaders 0.1 0.1 1940 1945 1950 1955 1960 1965 1970 1975 1980 1985 1990 1995 2000 2005 2010 1940 1950 1960 1970 1980 1990 2000 2010 Time (Year) Time (Year) Women are tagged as homemakers and tend to get stuck in basic careers Original – Promotions Not Biased
An Additional Adjustment: • Let’s also assume that the fraction of women “becoming homemakers” tags all women at ALL career levels as less suitable for promotion. • That is: Movement upward from ANY career category is limited by the perception that women are homemakers. • Based on the fraction that actually become homemakers.
0.5 Fraction of Each Work Category Who are Female 0.45 fraction of workforce 0.4 all basic careers early careers 0.35 0.3 Dmnl 0.25 0.2 established career path 0.15 senior workforce leaders 0.1 1940 1945 1950 1955 1960 1965 1970 1975 1980 1985 1990 1995 2000 2005 2010 Time (Year) Women are tagged as homemakers at the basic career level
0.5 Fraction of Each Work Category Who are Female 0.45 0.4 0.35 Dmnl 0.3 0.25 0.2 0.15 0.1 1940 1945 1950 1955 1960 1965 1970 1975 1980 1985 1990 1995 2000 2005 2010 Time (Year) Women are tagged as homemakers at ALL career levels fraction of workforce all basic careers early careers established career path senior workforce leaders
Conclusions & Comments: • Supply chain delays alone cannot account for the relatively low numbers of women in senior workforce positions in the US. • One alternate idea, that women’s movement throughout the employment chain is limited because they are tagged as homemakers, could explain the low numbers. • But several other explanations could also explain the bias.
Comments (continued): • Also, if there are sufficient numbers of women in the supply chain, then such things as special programs for women at universities are probably less important than are…. • Improvements in equity during promotion along the chain of workforce categories.
Questions ? Comments ? Contact: richard.dudley@attglobal.net