Download
1 / 30
300 likes | 426 Vues
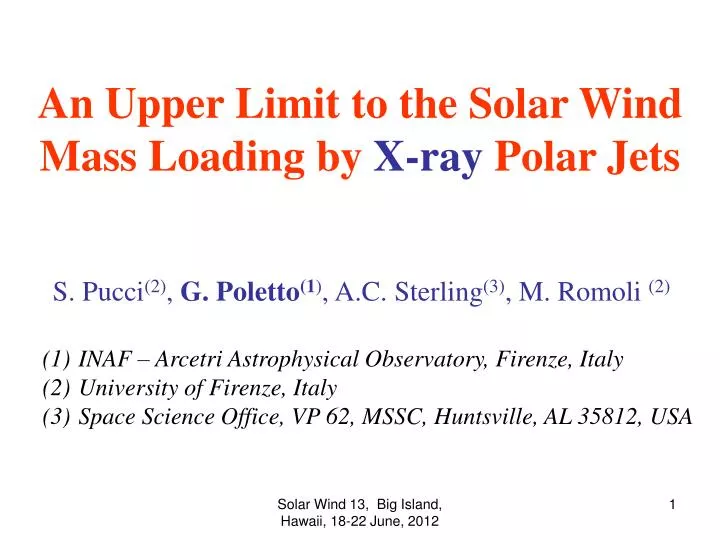
An Upper Limit to the Solar Wind Mass Loading by X-ray Polar Jets. S. Pucci (2) , G. Poletto (1 ) , A.C. Sterling (3) , M. Romoli (2). INAF – Arcetri Astrophysical Observatory, Firenze, Italy University of Firenze, Italy Space Science Office, VP 62, MSSC, Huntsville, AL 35812, USA.

E N D
An Upper Limit to the Solar Wind Mass Loading by X-ray Polar Jets S. Pucci(2), G. Poletto(1), A.C. Sterling(3), M. Romoli (2) • INAF – Arcetri Astrophysical Observatory, Firenze, Italy • University of Firenze, Italy • Space Science Office, VP 62, MSSC, Huntsville, AL 35812, USA Solar Wind 13, Big Island, Hawaii, 18-22 June, 2012
A little about CH history, motivation of the work, the data Solar Wind 13, Big Island, Hawaii, 18-22 June, 2012
Wind from Coronal Holes and Small Scale CH Structures • Since Krieger, Timothy and Roelof, in 1973, identified a Coronal • Hole as the source of a high speed stream, there has been a search • for the areas, within holes, where wind might originate. • Bright Points have been popular in the ’80s, because the wind mass • flux, measured at 1 AU is ~2 108 cm-2s-1 and BPs with a 1% areal coverage, densities of 109 cm-3 and outflows of 10 kms-1, might • provide for the wind mass flux. • The role of plumes in fast wind is controversial: still it looks likely • that they do not play a substantial role in solar wind • Are there other small scale features that we should consider as sources of solar wind? Solar Wind 13, Big Island, Hawaii, 18-22 June, 2012
Wind from Coronal Holes and X-ray Jets • Motivation of this work: HINODE XRT observations revealed jets to be much more frequent than previously expected. • Hence, they may constitute the source of solar wind. To check on this hypothesis we need to see whether jets might provide for the wind mass flux. • An evaluation of the wind mass flux requires we know • the speed and mass inflow from jets to the wind – here we make the hypothesis that jets do not fall back to the Sun. A preliminary • estimate of the jet wind mass loading led to a value of the order of 10% of the wind mass flux (Cirtain, 2007). Solar Wind 13, Big Island, Hawaii, 18-22 June, 2012
The data set for this work Jets come in two kinds: standard and blowout. We need to find a typical standard and a blowout jet and examine the wind mass flux that each type of jet can provide to the wind. We use data from HINODE and STEREO: more precisely for the standard jet, HINODE XRT multifilter data for the blowout jet, one HINODE filter, STEREO EUVI multifilters Solar Wind 13, Big Island, Hawaii, 18-22 June, 2012
The standard jet The first jet we examine is a standard jet that shows up in HINODE XRT images of the 1 July 2008 South polar coronal hole. These are the most frequent jets:~ 2/3 of all jets are of this type (Moore et al., 2010). The jet is hardly visible in STEREO EUVI images. Solar Wind 13, Big Island, Hawaii, 18-22 June, 2012
The blowout jet As a typical jet of this class we examine the jet that appeared in the North polar hole on November 3, 2007. Al-poly filter available in HINODE/XRT; 171, 195, 284, 304 filters available in STEREO/EUVI. Although blowout are less frequent than standard jets, they last longer and have multiple components: hence they may play a significant role in wind mass loading. Solar Wind 13, Big Island, Hawaii, 18-22 June, 2012
Physical parameters of the standard and blowout jet Solar Wind 13, Big Island, Hawaii, 18-22 June, 2012
Inferring the physical parameters of jets over their lifetime Inferring densities requires some preliminary steps evaluating temperatures derive emission measures make assumptions about the jet geometry Temperatures have been evaluated via the filter ratio technique either from XRT filters or from STEREO filters Technique: we measure the background intensity at the jet position and subtract it from the jet, then evaluate the ratio: In XRT => Al_poly/Al_mesh, and/or C_poly/Al_mesh , In EUVI=> 284/195, and 195/171 and derive Temperatures vs time and vs distance along the jet Solar Wind 13, Big Island, Hawaii, 18-22 June, 2012
Temperatures of the standard and blowout jet The temperature of the standard jet turns out to be ~ 1.3 106K (background ~ 1. 106K); no significant changes with time and along the jet The temperature of the blowout jet turns out to be (independent of the jet strand we examine) ~ 1.9 -2.0 106K; no significant changes with time or along the jet. Solar Wind 13, Big Island, Hawaii, 18-22 June, 2012
Densities in the two jets The density of the standard jet turns out to be ~ 1.2 109 cm-3 and decays exponentially along the jet axis and linearly in time. Because temperature is about constant, the intensity evolution at the base of the jet is a proxy for the density evolution. The density of the blowout jet turns out to be ~ 1. 109 cm-3 (independent of the jet strand we examine) and decays exponentially along the jet and linearly in time. Solar Wind 13, Big Island, Hawaii, 18-22 June, 2012
Outflows in the standard and blowout jet In order to evaluate the outflow speed of the jet we select the same area along the jet that we adopted for T, N measurements and by stacking these “columns” from sequential images vs. time we get distance-time profiles in the two jets: Standard jet Blowout jet strand The outflow speed is on the order of 100-130 kms-1 Solar Wind 13, Big Island, Hawaii, 18-22 June, 2012
Mass flux evaluation Solar Wind 13, Big Island, Hawaii, 18-22 June, 2012
Mass flux from jets In a single standard jet we have: nv ~ 1016 cm-2s-1 We assume the blowout jet to consist of multiple (3) strands and consider their individual sizes, NOT of the structure as a whole! In a single strand: nv ~ 1016 cm-2s-1 => 3 strands nv = 3 1016 cm-2s-1 Minimum nv value => standard 1016 cm-2s-1 blowout 3. 1016 cm-2s-1 Maximum nv value => standard 1.2 1016 cm-2s-1 blowout 4. 1016 cm-2s-1 (Min, max values considering lower limit/average values for outflow speed, respectively.) Solar Wind 13, Big Island, Hawaii, 18-22 June, 2012
Mass flux from jets From the previous slide: mass flux per jet per cm-2s-1. According to Savcheva (2007) there are about 60 jets/day. According to Cirtain (2007) there are about 240 jets/day. Hence, from Savcheva, 40 standard jets and 20 blowout jets. From Cirtain, 160 standard and 80 blowout jets. In a day, the mass inflow from standard jets is: Minimum nv/day => standard 40 1016 = 4. 1017 cm-2s-1 => blowout 20 3.1016 = 6. 1017 cm-2s-1 Maximum nv/day => standard 160 1016 = 1.6 1018 cm-2s-1 => blowout 80 4.1016 = 3.2 1018 cm-2s-1 minimum/maximm values from minimum/maximum estimates of frequency of jets Solar Wind 13, Big Island, Hawaii, 18-22 June, 2012
Mass flux from jets From the previous slide: mass flux from ALL jets per cm-2 s-1 Width of standard and blowout jets: 2.103 to 2.104 km wide. Lifetime of jets: ~ 700 s, standard, ~1400 s, blowout jets. In a day: Minimum particle number/day standard => 1.2 1034s-1 blowout => 1.9 1034s-1 Maximum particle number/day standard => 1.3 1036s-1 blowout => 2.5 1036s-1 Mass flux at 1 AU => minimum standard => 3.6 104 cm-2s-1 blowout => 1.1 105 cm-2s-1 maximum standard => 3.7 106 cm-2s-1 blowout => 1.4 107 cm-2s-1 (Minimum/maximum from min/aver surface base area of jets) vs. wind mass flux ~ 2 108 cm-2s-1 Solar Wind 13, Big Island, Hawaii, 18-22 June, 2012
Conclusions Solar Wind 13, Big Island, Hawaii, 18-22 June, 2012
The results we got tells us that, even if less numerous, blowout jets contribute more than standard jets to the wind mass loading However, the highest flux value we obtain is ~ 1.8 107 cm-2s-1 which is about 1/10 of the measured wind flux at Earth. Can we conclude X-ray jets are insignificant, as contributors to the solar wind mass flux?? I feel like this is a premature statement, as of today. Some further factors need to be considered: hereafter we deal in a very tentative way with a a couple of so far overlooked issues. Solar Wind 13, Big Island, Hawaii, 18-22 June, 2012
Do curtains contribute to the wind mass flux? - We did not include emission from “curtains”: curtain temperature unknown: only 1 channel in XRT!. Assuming a priori a temperature of about 1.3 106K and a density of 109cm-3, a duration of 24 minutes, a thickness of 1 pixel and a width of 5 pixels, it turns out the “curtain” contributes about as much as a standard jet to the mass input to the wind. Solar Wind 13, Big Island, Hawaii, 18-22 June, 2012
Do blowout related features, showing up at the jet footpoints, contribute to wind mass loading? Bright eleongated features have been imaged at a blowout jet footpoints by Morton et al., 2012; Ca II SOT images showed that a blowout jet produced 2 spicule-like features either side of a blowout jet (Sterling et al., 2010). SOT Ca II images of jet features at the footpoints of a blowout jet seen in EUV and soft X-rays (Sterling et al., 2010) AIA 304 (left) and 171 (right) images of a blowout jet in the southern polar CH of Jan1, 2011 (Morton et al., 2012) The ejections have properties similar to those of type II spicules. Solar Wind 13, Big Island, Hawaii, 18-22 June, 2012
Do blowout related features, showing up at the jet footpoints, contribute to wind mass loading? We know their lifetime (5 min), speed (100km/s), size (?): which is their density? IF we tentatively assume they have the same densities as those measured in “traditional” spicules (1011 -1012 cm-3), and that there are a couple of these features per blowout jet, we get a mass flux of ~ 4. 106 – 4. 107cm-2s-1 (depending on the assumed density value). This value is high enough to take us very close to the measured wind mass flux. Possibly, not a single class of jet but the whole jet family is providing for the wind mass flux. Solar Wind 13, Big Island, Hawaii, 18-22 June, 2012
Matter for further thoughts: • - Outflow speeds are a crucial factor. Assuming a factor 4 higher outflows, as might be plausible, gets us very close to what we need. • Also: do polar jets provide for the whole Sun? If they mostly contribute to polar wind and if the expansion factor is not too high, we get closer to what we need. • Need better statistics of the jet frequency: jets examined in this • work are strong jets! We need the jet energy spectum! • Do jets fall back? Which percentage? Solar Wind 13, Big Island, Hawaii, 18-22 June, 2012
The end Thank you! Solar Wind 13, Big Island, Hawaii, 18-22 June, 2012
The role of plumes as sources of fast wind IF plumes could be undisputably proved to be the site of higher outflows than interplume lanes, still • → their percentage occupancy of CH areas, at present estimated to be < 10%, is insufficient for a substantial contribution to the fast wind (e.g. Curdt et al., 2008). There are contrasting opinions, though: Gabriel et al. (2008) favor a substantial plume role. • → Gupta et al. (2010) report on disturbances propagating in plumes and interplumes: most likely slow magnetosonic in plumes fast magnetoacoustic or Alfvénic in interplumes, favoring the latter as preferred channels for acceleration of fast wind. • → Raouafi et al. (2007) can reproduce OVI lines profiles in CHs only by assuming plume plasma is slower and cooler than the ambient (up to 2 R☼, reaching ambient values at 3 solar radii). Hence: evidence points to a minor role of plumes in fast wind! Solar Wind 13, Big Island, Hawaii, 18-22 June, 2012
So far we dealt with BPs and plumes as unrelated, independent, structures → actually early phase of plume formation is seen to occur in association with BPs → possibly BPs are precursors of plume formation → Raouafi et al. (2008) claimed jets are precursors of plume formation: should we shift emphasis to jets?? → indeed Cirtain et al. (2008) found more jets than previously observed in HINODE XRT data: small scale features, width 103 – 104 km, lifetimes 100 – 1500 s, frequency of occurrence 10/hour. Jet contribution to fast wind ~ 10% Solar Wind 13, Big Island, Hawaii, 18-22 June, 2012
Matter for controversy? McIntosh et al. (2010) analyzing STEREO data report on high speed jets of plasma traveling along plumes with a mean velocity of 135 Km/s: these jets repeat quasi periodically and are interpreted in terms of source of heated mass to the fast wind. Is this correct, or are the observed phenomena due to compressive magnetoacoustic waves?? Gabriel et al. (2009) claim there are two types of plumes: the usual“beacon” plumes and “network plumes”: ubiquitous in polar holes, requiring integration along the line of sight to be reproduced, and concentrated within 5 Mm of cell boundaries. As with standard plumes, reconnection of emerging loops with the ambient unipolar fields is required to account for their presence. Because they are more abundant than beacon plumes, their role in heating the corona and accelerating the solar wind may be more relevant than hitherto assumed. Are all X-ray jets contributing to solar wind, or do they fall back? Examples of jets that fail to reach the escape speed and fall back along the near vertical path created by reconnection with open CH fieldlines have been found (e.g., Baker et al., 2008). Solar Wind 13, Big Island, Hawaii, 18-22 June, 2012
A radially expanding wind? The figure relates Ulysses ranging and scintillation measurements to lower coronal data showing that data at 20-30 solar radii mimic the structure of the inner corona: Hence the authors claim, in particular, that the coronal hole boundary extend radially. As a consequence, fast wind propagates along radially oriented structures from all over the Sun. In a recent paper Woo and Druckmürellova (2008) point out that coronal processed images stress density differences, thus exhaggerating the real latitudinal variation of coronal densities and their radial gradient. Plumes possibly not showing the shape of magnetic fields! Woo and Habbal, 1999 Solar Wind 13, Big Island, Hawaii, 18-22 June, 2012