Download

1 / 24
240 likes | 331 Vues
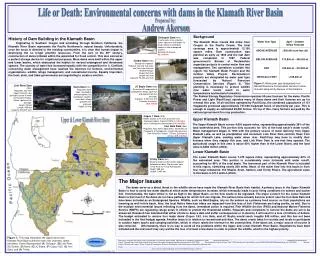
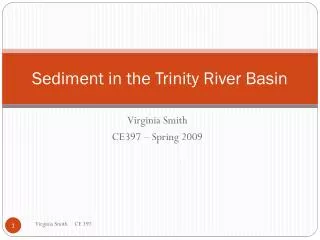
Ponds and Dams in the Pedernales River Basin. John Middleton CE 394K.2 May 2005. Project Goal. Develop a simple water balance model to predict water levels in various storage structures. Simple to use Data readily available Works Challenges How to calibrate. Motivation.

E N D
Ponds and Damsin thePedernales River Basin John Middleton CE 394K.2 May 2005
Project Goal Develop a simple water balance model to predict water levels in various storage structures. • Simple to use • Data readily available • Works Challenges • How to calibrate
Motivation • Ponds and dams on family property • Roy Bedichek’s idea of “little waters” as habitats
Analyze a progression of storage systems Cistern Tank Dam on intermittent creek Dam on river Approach
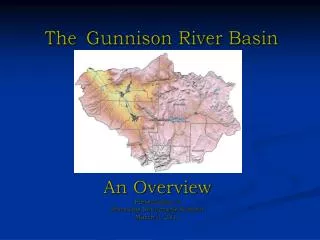
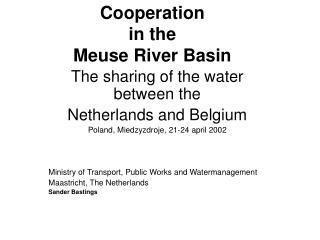
Pedernales Watershed You Are Here Pedernales River Basin: 1294 mi²
Tools ArcGIS Watershed areas Landcover estimates Mathcad Infiltration model Excel Water balance calculations Data Precipitation NCDC, TWDB Evaporation TWDB Wells TWDB Flow USGS Miscellaneous – LCRA pubs, textbooks, Dad Tools and Data
Plan A • Develop a monthly water balance in Excel • Infiltration – Mathcad Green-Ampt 2-layer model • Runoff estimates using SCS curve • Estimate demand based on published livestock consumption numbers • Assume storage volumes have uniform depth and vertical sides
Cistern P - E - D Earthen Tank P - E - I - D + R Dam on Creek P - E - I - D + R + B P = Precipitation E = Evaporation D = Demand I = Infiltration R = Runoff B = Base Flow In Water Balance
Plan B • Use daily rain data 1st Approach used mean monthly data • Problems with SCS model – single rain value not representative of the rain distribution
Tank Catchment • Drainage: 235 acres • Tank depth: 8ft • Tank area: 1000 ft2
Cistern/Tank Model Drainage: 235 acres Depth: 8ft Area: 1000 ft2 Start Depth: 8ft
Cistern/Tank Model Drainage: 235 acres Depth: 8ft Area: 1000 ft2 Start Depth: 0ft
Cistern/Tank Model Drainage: 235 acres Depth: 8ft Area: 1000 ft2 Start Depth: 0ft
Upper Fall Creek Dam Catchment • Drainage: 3852 acres • Depth: 6ft • Tank area: 23,774 ft2
Dam Model Drainage: 3582 acres Depth: 6ft Area: 23,774 ft2 Start Depth: 6ft
Conclusions • Cistern/Tank model appears reasonable • Dam model • Difficult to calibrate • Creek baseflow not known • Runoff/infiltration model may be overly simplistic • Excel is good, but I’m tired of it
Model Improvements • Infiltration model – convert to VB routine • SCS method needs daily data • Spring flow estimates • Shape of storage structure • NARR for evaporation • Doppler for rainfall • Improved runoff method
Cistern/Tank Model Drainage: 235 acres Depth: 8ft Area: 1000 ft2 Start Depth: 0ft