Download
1 / 23
230 likes | 352 Vues
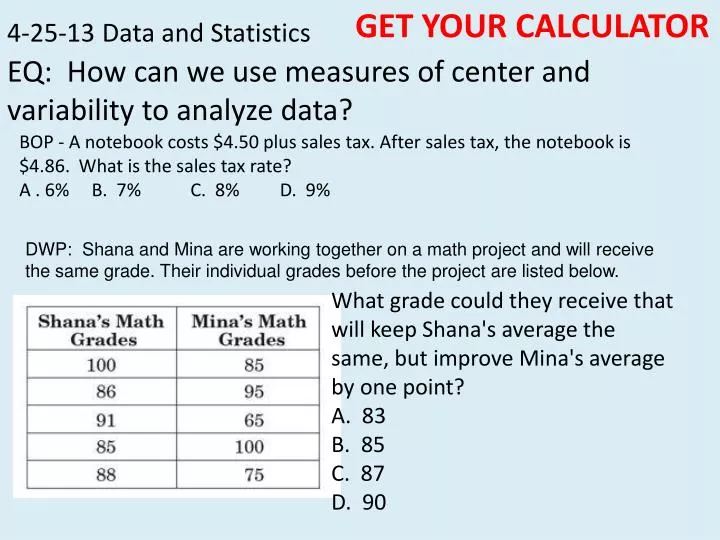
GET YOUR CALCULATOR. 4-25-13 Data and Statistics. EQ: How can we use measures of center and variability to analyze data?. BOP - A notebook costs $4.50 plus sales tax. After sales tax, the notebook is $4.86 . What is the sales tax rate? A . 6% B. 7% C. 8% D. 9 %.

E N D
GET YOUR CALCULATOR 4-25-13 Data and Statistics EQ: How can we use measures of center and variability to analyze data? BOP - A notebook costs $4.50 plus sales tax. After sales tax, the notebook is $4.86. What is the sales tax rate? A . 6% B. 7% C. 8% D. 9% DWP: Shana and Mina are working together on a math project and will receive the same grade. Their individual grades before the project are listed below. What grade could they receive that will keep Shana's average the same, but improve Mina's average by one point? A. 83 B. 85 C. 87 D. 90
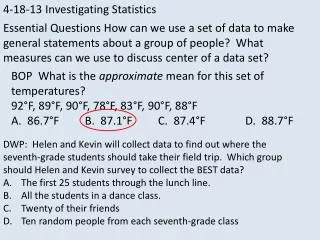
One lap around a track is equal to one-eighth of a mile. A horse ran a distance of 9 laps in 2 minutes and 30 seconds. What was the horse’s average speed in miles per minute? 1.125 miles÷2.5 min. = .45 miles per minute The correct answer is D. Taken from former DPI Sample Items for Grade 7 Mathematics Goal 4 2008
One lap around a track is equal to one-eighth of a mile. A horse ran a distance of 9 laps in 2 minutes and 30 seconds. What was the horse’s average speed in miles per minute? .45 miles per minute
Look back over you Study Guide and be sure you have definitions and examples for each page. This will be collected for a quiz grade on Tuesday.
A histogram is a bar graph that shows the frequency of data within equal intervals. There is no space between the bars in a histogram. Follow these steps to make a histogram: Step 1: Make a frequency table of the data. Be sure to use equal intervals. Step 2: Choose an appropriate scale and interval for the vertical axis. The greatest value on the scale should be at least as great as the greatest frequency. Step 3: Draw a bar graph for each interval. The height of the bar is the frequency for that interval. Bars must touch but not overlap. Step 4: Label the axes and give the graph a title. PUT THESE STEPS IN YOUR STUDY GUIDE!
Write the information below in your Study Guide Variability - Degree to which data are spread out around a center value
1. 2. Write a few sentences that comparing their variation.
Exit Ticket COMPLET QUESTIONS ON BOX PLOTS Homework: Handout