Download
1 / 16
160 likes | 265 Vues
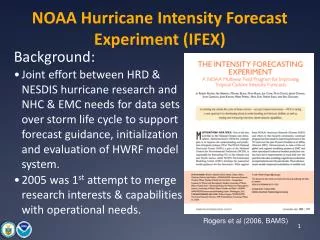
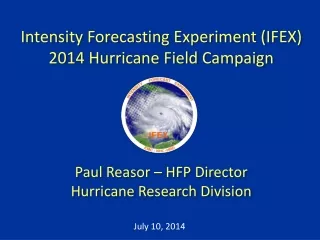
Summary of NOAA's 2010 Hurricane Field Program (IFEX) Robert Rogers – 2010 HFP Field Program Director. Intensity Forecasting Experiment (IFEX; Rogers et al., BAMS, 2006). IFEX intended to improve prediction of TC intensity change by:

E N D
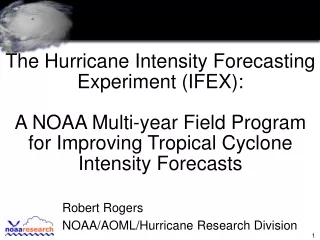
Summary of NOAA's 2010 Hurricane Field Program (IFEX) Robert Rogers – 2010 HFP Field Program Director
Intensity Forecasting Experiment (IFEX; Rogers et al., BAMS, 2006) IFEX intended to improve prediction of TC intensity change by: collecting observations that span TC life cycle in a variety of environments for model initialization and evaluation developing and refining measurement technologies that provide improved real-time monitoring of TC intensity, structure, and environment improving understanding of physical processes important in intensity change for a TC at all stages of its life cycle These goals provide the linkage between observations, modeling, and theory that form the foundation of the Hurricane Forecast Improvement Project (HFIP)
Focus areas for 2010 IFEX goal 1: Collecting observations for model initialization/evaluation • Tail Doppler radar • Synoptic surveillance with Global Hawk • HWRFx/HFIP real-time runs IFEX goal 2: Developing and refining measurement technologies • Coyote low-level UAS • Doppler Wind Lidar • Ocean winds/AWRAP • Global Hawk high-level UAS IFEX goal 3: Improving understanding • Genesis • Rapid Intensity Change • TC-Ocean interaction • Saharan Air Layer • Landfall and Inland Decay • TC/AEW Arc Cloud • Hurricane PBL Entrainment Flux • Aerosol/Cloud Droplet measurement
Intensity Forecast experiment (IFEX 2010) • Summary: • NOAA aircraft flew ~420 h (28 P-3 and 19 G-IV missions) in 9 tropical systems, and 3 Gulf ocean survey missions • Deployed ~1000 GPS dropsondes; ~200 ocean probes (AXBT/CP/CTD) • Performed 79 Doppler analyses& SO data sets • Performed 125 H*Wind analyses • Performed 380 HWRFx simulations in 11 storms and 9 invests • 17 HEDAS analyses & HWRFx runs for Hurricanes Earl, Karl, and Tomas • 2 coordinated P-3/Global Hawk missions – 1 each in Earl & Karl • ONR DWL installation delayed • G-IV TDR acceptance tests delayed Courtesy wunderground.com For details see: http://noaahrd.wordpress.com/category/ifex-discussion • TD 2 & 5, TS Alex, Bonnie, Matthew, Richard, Hurricanes Earl, Karl and Tomas plus 3 Gulf pre-storm ocean survey missions (+10 ocean survey missions in support of DWH spill - unprecedented upper ocean data set over Gulf of Mexico for coupled modeling) Focus will be on two “featured” datasets: Earl and Karl
P-3 and G-IV coverage during intensity evolution of Earl P-3 missions G-IV missions Date/Time (dd/hhhh)
Evolution of axisymmetric tangential wind (shaded, m/s) during RI phase of Earl 0 14 14 14 14 13 13 13 13 13:40Z Aug 30 21:44Z Aug 28 21:00Z Aug 29 12 12 12 12 11 11 11 11 height (km) 10 10 10 10 9 9 9 9 8 8 8 8 7 7 7 7 6 6 6 6 5 5 5 5 4 4 4 4 3 3 3 3 2 2 2 2 1 1 1 1 0 0 0 0 21:23Z Aug 30 22:13Z Aug 29 23:03Z Aug 28 height (km) 22:31Z Aug 30 09:39Z Aug 29 00:44Z Aug 30 height (km) 11:58Z Aug 29 11:17Z Aug 30 23:33Z Aug 30 45 45 45 45 40 40 40 40 height (km) 35 35 35 35 30 30 30 30 25 25 25 25 20 20 20 20 m/s 0 0 0 50 50 50 75 75 75 100 100 100 125 125 125 150 150 150 175 175 175 200 200 200 25 25 25 radius (km) radius (km) radius (km)
Evolution of wind speed (shaded, m/s) from 1-9 km altitude during steady-state phase of Earl 0114Z Sept 2 2343Z Sept 2 9 km 9 km x x 5 km 5 km x x 1 km 1 km x x
Hodographs of inner-core winds (m/s) from 0.5-12 km altitude for Earl 9 5 3 6 7 10 4 8 11 11 8 9 12 10 2 12 7 6 1 5 4 3 2 1
Summary for Earl flights • historic dataset collected in Hurricane Earl • nearly complete lifecycle, sampled at 12-h intervals for inner core by P-3’s, 24-h intervals for environment by G-IV • significant RI episode sampled by Doppler radar prior to, during, and after • steady-state period as a major hurricane sampled, including vortex interaction with increasing upper-level SW shear • weakening stages sampled, including period leading up to ET First thoughts on questions to address • how does vortex evolve during RI? Symmetric and asymmetric evolution? Kinematic and thermodynamic evolution? • what’s relative role of convective-, vortex-, and environmental-scale processes in RI? • how does mature hurricane respond to increasing vertical shear (tilt, wind field asymmetries)? • what is structural change during weakening and prior to ET? • and many more…..
P-3 and G-IV coverage during intensity evolution of Hurricane Karl (2010) P-3 missions G-IV missions
Doppler and dropsonde composites during pre-genesis stage of Karl 6 km 1 km 23:56Z Sept. 12 23:56Z Sept. 12 6 km 12:00Z Sept. 13 1 km 6 km 1 km 1 km 12:00Z Sept. 13 01:04Z Sept. 13 01:04Z Sept. 13
Summary for Karl flights • good coverage during pre-genesis stage of Karl, in particular with dropsonde data and combined with other agencies’ aircraft (G-V, DC-8) • radar coverage limited during genesis stage • observations showed a disorganized circulation gradually becoming better organized during the 36 h system was sampled by P-3 • significant RI episode sampled by Doppler radar after emerging from Yucatan, but only one flight First thoughts on questions to address • how did the circulation of the incipient depression evolve during multiple days prior to designation as a T.D. (T.S.)? Was circulation maximized in midlevels first or at low levels? • what was thermodynamic environment within the slowly-developing core and environment? How did that change over time? • how can observations from P-3 be combined with observations from DC-8 and Global Hawk, both during genesis and RI stages, to provide depiction of vortex and environmental evolution? • how can this data best be used to initialize and evaluate numerical model performance? • and many more…..
Interactions with other experiments • NASA GRIP (Genesis and Rapid Intensification Processes, 8/15-9/30) • DC-8 -- based in Ft. Lauderdale, GH -- based in Dryden, CA • Scott Braun, Ed Zipser, Gerry Heymsfield aircraft leads • GH flew missions over Hurricanes Earl and Karl, good coverage of RI stage of Karl • NSF PREDICT (PRE-Depression Investigation of Cloud systems in the Tropics, 8/15-9/30) • G-V – based in St. Croix • Mike Montgomery, Chris Davis, Andy Heymsfield, Lance Bosart leads • Excellent dropsonde coverage in pre-genesis stage of Karl
2011 IFEX coming soon… • Shirley Murillo - Hurricane Field Program Director • Continue addressing IFEX/HFIP goals • Sustain our partnerships with EMC and NESDIS • Strengthen our interactions with NHC • Encourage greater awareness in broader TC community