Download
1 / 38
380 likes | 551 Vues
BPS School Climate Surveys. SY 2012-2013 Office of Data and Accountability. Welcome and Intros Activity: Your Vision for Family & Student Engagement School Climate Survey Overview School Level Data Review Wrap Up. Agenda. By the end of this session, you will be able to:

E N D
BPS School Climate Surveys SY 2012-2013 Office of Data and Accountability
Welcome and Intros • Activity: Your Vision for Family & Student Engagement • School Climate Survey Overview • School Level Data Review • Wrap Up Agenda
By the end of this session, you will be able to: • Interpret school climate data • Use climate data to identify areas of strength and areas for improvement in school-wide engagement practices • Tap into OFSE supports for planning/implementing school-wide engagement practices Objectives
Write your vision for family & student engagement in your school on a note card (no more than 50 words) • Share your ideas with a partner. Your Vision for Family & Student Engagement in Your School
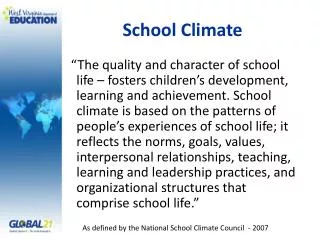
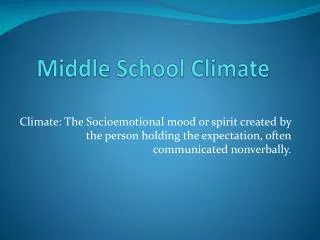
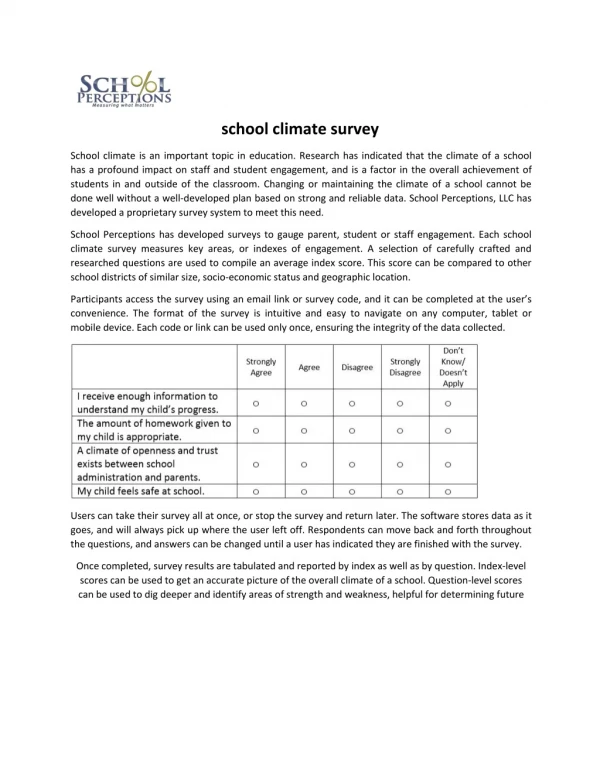
What is school climate? • No clear definition in research • Encompasses experiences and atmosphere in schools • Why do we administer climate surveys? • Assess climate of our schools from constituents’ perspectives • Provide data to plan for improvement • Provide a forum for parents, students, and teachers to voice their opinions Climate Surveys
Based on a meta-analysis of research on factors that are related to academic achievement at the K-12 level, variables in four major categories demonstrate “direct empirical links”1 • Student engagement • Learning strategies • School climate • Social-familial influences 1Lee, Jihyun and Shute, Valerie J. (2010) ‘Personal and Social-Contextual Factors in K-12 Academic Performance: An Integrative Perspective on Student Learning’, Educational Psychologist, 45: 3, 185 Research shows school climate is important for student achievement
Academic emphasis • “Expectations of schools for their students and positive reactions from school community”2 • Teacher variables • “Collective efficacy, teacher empowerment, sense of affiliation”3 • Principal leadership • “Collegiality, setting high morale, and clearly conveying goals”4 2Lee, Jihyun and Shute, Valerie J. (2010) ‘Personal and Social-Contextual Factors in K-12 Academic Performance: An Integrative Perspective on Student Learning’, Educational Psychologist, 45: 3, 187 3Ibid 4Ibid 1Lee, Jihyun and Shute, Valerie J. (2010) ‘Personal and Social-Contextual Factors in K-12 Academic Performance: An Integrative Perspective on Student Learning’, Educational Psychologist, 45: 3, 185 School Climate
In BPS, we began administering the climate surveys in Spring 2009 • Today, the surveys are administered: • Online for teachers, with follow-up email reminders (3) including response rate updates to all teachers by school. Survey responses are anonymous. • On paper for students (grades 3 through 11). Beginning in 2012, seniors complete a separate Senior Exit Survey. Student responses to both surveys are linked to their BPS IDs so that results can be analyzed by demographic characteristics. • Online and paper for parents and guardians, in all 8 languages. Parents receive the initial survey through backpacks, followed by a reminder postcard mailed directly to the home; and a second copy of the survey also mailed directly to the home. Parent responses are anonymous and linked only to the school(s) their child attends. History of Climate Surveys in BPS
Factor analysis of all items to determine which items belong together in a component • Compute each component for individuals by averaging individual responses • Compute average component scores for whole district and for individual school by averaging all component scores in each group Analysis of Climate Surveys
District-wide report located on www.bostonpublicschools.org under “Reports” tab • Individual school results located on www.bostonpublicschools.org under individual school page Distribution of Data
Student Survey District Results: 2011-2012 *40 responses did not have a grade level.
Student Survey District Results: 2011-2012 *40 responses did not list a gender.
Student Survey District Results: 2011-2012 *40 responses did not list a special education status.
Student Survey District Results: 2011-2012 *40 responses did not list a lunch status.
Student Survey District Results: 2011-2012
Student Survey District Results: 2011-2012 *40 responses did not list a LEP/FLEP status.
Student Survey District Results: 2011-2012
Student Survey District Trends
*District Average: 78.8% **See attached handout for individual school response rates Range of Responses: Student Survey 2011-2012
Parent Survey District Results: 2011-2012
Parent Survey District Trends
*District Average: 23.6% **See attached handout for individual school response rates Range of Responses: Parent Survey 2011-2012
Teacher Survey District Trends: 2011-2012
Teacher Survey District Trends
*District Average: 65.0% **See attached handout for individual school response rates Range of Responses: Teacher Survey 2011-2012
Parent and Student Engagement Questions: Teacher Survey2011-2012