Download

1 / 43
430 likes | 652 Vues
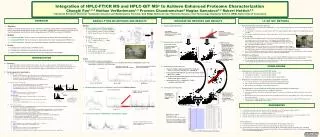
Proteins for proteomics. Depends on the scale required: • structural proteomics (mg) • biochemistry (ug) • protein markers and mass spectrometry (ng) Microbes offer the best means for making proteins • E coli • Pichia • brewer ’ s yeast • Sf9 insect cells. Proteins for proteomics.

E N D
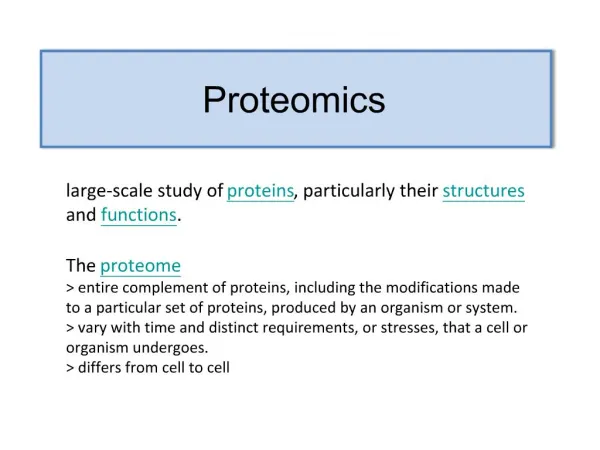
Proteins for proteomics Depends on the scale required: • structural proteomics (mg) • biochemistry (ug) • protein markers and mass spectrometry (ng) Microbes offer the best means for making proteins • E coli • Pichia • brewer’s yeast • Sf9 insect cells
Proteins for proteomics • also better than bacteria at making disuphides • grows in 1% glycerol or 0.5 % methanol as carbon source
• note promoter, operator, rbs, terminator • requirement for T7 pol, BL21:DE3 cells
• make overnight • inoculate and wait for A600 = 0.8 (what’s that) • harvest cells • crack by french press, BPER or sonication • purify the protein --- by affinity generally • His tag generally reigns supreme (why?)
Codon Bias and Gene Structure tRNA pool tyr leu ala arg leu phe trp phe
Codon Bias and Gene Structure tRNA pool frequency of observation UUU = 80% UUC = 20% tyr leu ala arg leu phe trp phe UUU UUC • does codon usage drive tRNA evolution or • does tRNA evolution drive codon usage or • a bit of both ?
• there is a large variation in codon usage even among micro-organisms http://phenotype.biosci.umbc.edu/index.php?page=What_is_CAI
codon usage in all E coli genes and those in class-II (highly expressed) vary a lot for Arg/Gly/Ile/Leu/Pro
to account for differences between codon usage in human and E coli, rare genes can be augmented essentially ‘humanizing’ the bacterium (from Novagen / Rosetta cells)
CAI – Codon Adaptation Index • a mathematical/statistical description of how well a gene is adapted to the translational machinery of the organism (Li and Sharp, 1987). • CAI values vary from 0 to 1. • A score of 1 suggests a gene will be expressed well • The CAI table was generated by examining highly expressed genes. • Each codon is assigned a fitness score of how well it is adapted to the tRNA pool
CAI – Codon Adaptation Index • There is considerable variation among the CAI of all genes in a given organism with a normal distribution • the variance depends on GC content
Recruiting Ribosomes Prokaryotes Shine-Dalgarno sequence (@ -16) AGGAGGU Eukaryotes Kozak sequence (@ -6)
Codon Bias and Gene Structure Kudla et al. 2009. Science 324: 255
Codon Bias and Gene Structure • design PCR primers that have degeneracies at the wobble position. Use overlapping ends to accomplish assembly-PCR. Place in a variety of E. coli expression vectors. • of the 240 codons in GFP, 226 could be changed with silent mutations. • the average protein had 114 substitutions. Kudla et al. 2009. Science 324: 255
Codon Bias and Gene Structure • here are the sequences of some of the 154 GFP variants that the authors examined. The grey shading identifies the invariant codon positions (non-wobble). • the sequences spanned the 96% of the normal CAI range for E. coli Kudla et al. 2009. Science 324: 255
Codon Bias and Gene Structure GFP genes All E. coli genes • here, the authors demonstrate that the GC3 score (content of Gua or Cyt at the wobble position) and the CAI (codon adaptation index or the preference of the bacterium to use a certain codon) had the same distribution of all native E. coli genes Kudla et al. 2009. Science 324: 255
Results • when the genes were expressed, there was considerable variation in the amount of GFP made Kudla et al. 2009. Science 324: 255
• there was no correlation between CAI and the amount of GFP ! Kudla et al. 2009. Science 324: 255
• the amount of secondary structure in the mRNA correlated better than CAI Kudla et al. 2009. Science 324: 255
• where the secondary structure occurred correlated very well with expression Kudla et al. 2009. Science 324: 255
Codon Bias and Gene Structure • activity was measured by a fluorescence assay. The levels of GFP-expression varied 250-fold (28) independent of the promoter used (bacterial or viral) Kudla et al. 2009. Science 324: 255
Codon Bias and Gene Structure • an engineered upstream sequence that purposely had no RNA secondary around the transcription start site was included, high expression was restored Kudla et al. 2009. Science 324: 255
When choosing a protein fragment to express, purify, and possibly solve • size matters !