Download
1 / 16
160 likes | 285 Vues
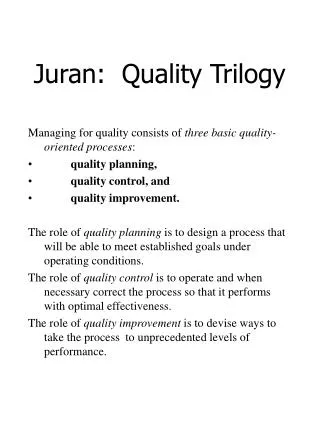
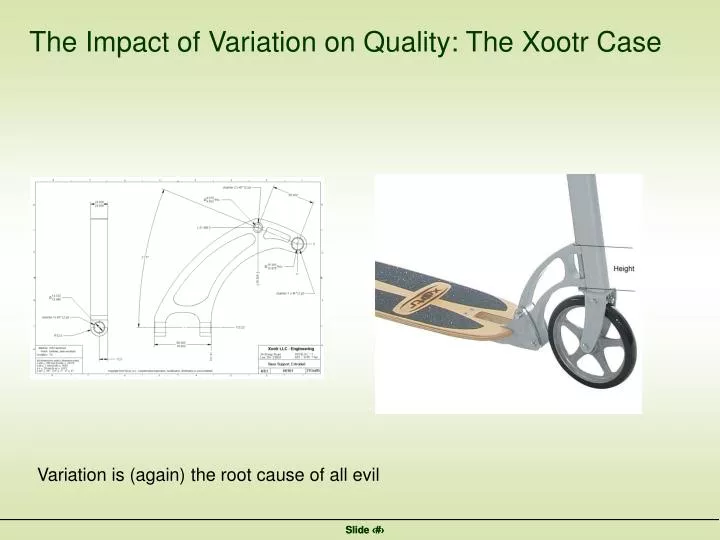
The Impact of Variation on Quality: The Xootr Case. Variation is (again) the root cause of all evil. Choosing the Appropriate Control Chart. (MJ II, p. 37). Attribute (counts) Variable (measurable). The Lean Six Sigma Pocket Toolbook, p. 123. Defect Defective.

E N D
The Impact of Variation on Quality: The Xootr Case Variation is (again) the root cause of all evil
Choosing the Appropriate Control Chart (MJ II, p. 37) Attribute (counts) Variable (measurable) The Lean Six Sigma Pocket Toolbook, p. 123. Defect Defective
Different types of control charts Attribute (or count) data Situation Chart Control Limits Number of defects, accidents or flaws # of accidents/week # of breakdowns/week # of flaws on a product C U Lean Six Sigma Pocket Toolbook, p. 132. source: Brian Joiner, Fourth Generation Management, p. 266-267.
Different types of control charts Attribute (or count) data Situation Chart Control Limits Fraction of defectives fraction of orders not processed perfectly on first trial (first pass yield) fraction of requests not processed within 15 minutes p np Lean Six Sigma Pocket Toolbook, p. 132. source: Brian Joiner, Fourth Generation Management, p. 266-267.
Different types of control charts Variables (or measurement ) data Situation Chart Control Limits Variables data, sets of measurements X-”BAR” CHART Xbar and R Charts R CHART See MJ II p. 42 for constants A2, D3 and D4. Lean Six Sigma Pocket Toolbook, p. 127. source: Brian Joiner, Fourth Generation Management, p. 266-267.
Parameters for Creating X-bar Charts Lean Six Sigma Pocket Toolbook, p. 128.
The X-bar Chart: Application to Call Center • Collect samples over time • Compute the mean: • Compute the range: as a proxy for the variance • Average across all periods - average mean - average range • Normally distributed
Control Charts: The X-bar Chart 12 10 8 6 4 2 0 1 3 5 7 9 11 13 15 17 19 21 23 25 27 • Define control limits • Constants are taken from a table • Identify assignable causes: - point over UCL - point below LCL - many (6) points on one side of center • In this case: - problems in period 13 - new operator was assigned
Attribute Based Control Charts: The p-chart =0.052 UCL= + 3 LCL= - 3 = s s s ˆ ˆ ˆ Period n defects p • Estimate average defect percentage • Estimate Standard Deviation • Define control limits • Divide time into: - calibration period (capability analysis) - conformance analysis =0.013 =0.091 =0.014
Statistical Process Control Capability Analysis Conformance Analysis Eliminate Assignable Cause Investigate for Assignable Cause • Capability analysis • What is the currently "inherent" capability of my process when it is "in control"? • Conformance analysis • SPC charts identify whencontrol has likely been lost and assignable cause variation has occurred • Investigatefor assignable cause • Find “Root Cause(s)” of Potential Loss of Statistical Control • Eliminate or replicate assignable cause • Need Corrective Action To Move Forward
Exercise An automatic filling machine is used to fill 16 ounce cans of a certain product. Samples of size 5 are taken from the assembly line each hour and measured. The results of the first 25 subgroups are shown in the attached file with selected rows shown below. Does the process appear to be in statistical control? Source: Shirland, Statistical Quality Control, problem 5.2. If the specification limits are USL = 16.539 and LSL = 15.829 is the process capable?
Consider a data entry operation that makes numerous entries daily. On each of 24 consecutive days subgroups of 200 entries are inspected. Develop a p control chart for this process. Gitlow, Openheim, Openheim & Levine, Quality Management, 3ed.