Download
1 / 23
230 likes | 350 Vues
The use of both neutron and ion irradiation to show the microstructural origins of strong flux-sensitivity of void swelling in model Fe-Cr-Ni alloys. T. Okita, N. Sekimura and T. Iwai. University of Tokyo, Tokyo, Japan. F.A. Garner. Pacific Northwest National Laboratory, Richland, WA, USA.

E N D
The use of both neutron and ion irradiation to show the microstructural origins of strong flux-sensitivity of void swelling in model Fe-Cr-Ni alloys T. Okita, N. Sekimura and T. Iwai University of Tokyo, Tokyo, Japan F.A. Garner Pacific Northwest National Laboratory, Richland, WA, USA
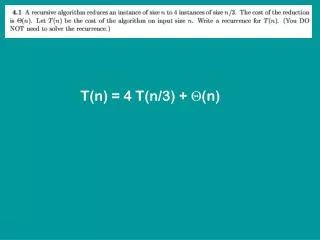
Outline of this presentation • Neutron irradiation experiment on Fe-15Cr-16Ni conducted in FFTF fast neutron reactor at ~ 426 ˚C at seven dose rates between 8.9 x 10⁻⁹ to 1.7 x 10⁻⁶ dpa/sec. • Ion irradiation experiment on the identical Fe-15Cr-16Ni conducted with 4 MeV Ni3+ ions at 300, 400, 500, and 600 ˚C at three different dose rates between 1.0 x10⁻³ to 1.0 x 10⁻⁴ dpa/sec.
BC 1 2 3 4 5 6 7 8 10-5 BELOW CORE FFTF CORE ABOVE CORE 10-6 10-7 10-8 10-9 -100 -75 -50 -25 0 25 50 75 100 120 150 Neutron irradiation ; FFTF/MOTA Materials Open Test Assembly Multiple specimens at each condition. Irradiation at seven positions in, below and above the core. dpa/sec in stainless steels 2 cycles of irradiation in FFTF cycles #11 and #12 to achieve two dose levels at each dose rate. Distance from midplane (cm)
Neutron irradiation conditions 426 ± 18 ˚C Constant time experiment 2.59 x 10 7 sec (Cycle #11) 1.76 x 10 7 sec (Cycle #12)
Previous studies for the effect of dose rates For austenitic alloys, there are not enough studies, with sufficiently detailed databases for high dose rate irradiation. Typically, the effects of dose rate have been investigated covering less than one order difference in dose rate. Microstructural response depending on such a small difference in dose rate might lie within the experimental error bands, however.
Previous studies for the effect of dose rates It has been possible to achieve wider ranges of dose rates from comparison of results obtained in two or three different reactors. However, difficulties remain in such comparative studies because of simultaneous changes in other important irradiation parameters, such as the neutron energy spectrum or temperature history.
Neutron irradiation conditions in this study • Fast neutron irradiation in FFTF reactor More than two orders difference in dose rates achieved in one reactor. Active temperature control system at ± 5 ˚C, using a variation of He / Ar gas ratio in the gas gap.
Cavity microstructure in Fe-15Cr-16Ni 8.9 x 10⁻⁹ dpa/sec 3.1 x 10⁻⁷ dpa/sec 1.7 x 10⁻⁶ dpa/sec 0.23 dpa 8.05 dpa 43.8 dpa 1 cycle 0.61 dpa 11.1 dpa 67.8 dpa 2 cycles 100 nm
Fe-15Cr-16Ni, SA 408 - 444 ˚C Enhanced swelling at lower dose rate - Density change and microscopy data - 30 1%/dpa 5.4 20 Swelling (%) • Lower dose rate enhances swelling by shortening the incubation dose. • The steady state swelling rate is not affected by the difference in dose rate. 387 ˚C 7.8 10 3.1 17 x 10-7 0.9 dpa/sec 390 ˚C 0 0 10 20 30 40 50 60 70 Cumulative Dose (dpa)
Fe-15Cr-16Ni, SA 430 - 444 ˚C Enhanced swelling at lower dose rate • The steady state swelling rate is also observed at dose rates as low as < 10-7 dpa/sec and irradiated less than 1 dpa. • The incubation dose of swelling can therefore vary from < 1dpa to > 45 dpa when the dose rate varies over more than two orders of magnitude. Swelling (%) Cumulative Dose (dpa)
Fe-15Cr-16Ni, SA 430 - 444 ˚C Enhanced swelling at lower dose rate • The steady state swelling rate is also observed at dose rates as low as < 10-7 dpa/sec and irradiated less than 1 dpa. • The incubation dose of swelling can therefore vary from < 1dpa to > 45 dpa when the dose rate varies over more than two orders of magnitude. Swelling (%) Incubation Dose Cumulative Dose (dpa)
1 0 0 Fe-15Cr-16Ni, SA 408 - 444 ˚C 3 9 0 / 3 8 7 ℃ 1 0 1 0 . 9 9 ( d p a / s e c ) 0 . 1 - 5 - 8 - 7 - 6 1 0 1 0 1 0 1 0 Strong effect of dose rate on incubation dose • The incubation dose of swelling is almost linearly proportional to dose rate. Incubation Dose (dpa) Dose Rate (dpa/sec)
Fe-15Cr-16Ni, SA 408 - 444 ˚C Enhanced dislocation evolution at lower dose rate 10 387 ˚C 7.8 8 3.1 390 ˚C • • Lower dose rate enhances dislocation evolution. • This effect arises primarily from the enhanced loop growth at lower dose rate. 17 x 10-7 dpa/sec 6 0.9 5.4 Total Dislocation Density (x1014 m-2) 4 2 0.27 0.089 0 0 10 20 30 40 50 60 70 Cumulative Dose (dpa)
Fe-15Cr-16Ni, SA 410 - 444 ˚C Dose rate dependence of loop density At relatively low doses, the loop density is proportional to (dpa/sec)1/2. This is agreed with the previous analysis that the saturated loop density is proportional to (dpa/sec)1/2. Dislocation loop density is not proportional to (dpa/sec)1/2 at doses higher than ~ 10 dpa, because loop unfaulting had occurred. 1023 (dpa/sec)1/2 1022 8.05 11.1 6.36 1.87 Loop Density (m-3) 14.0 2.36 0.61 0.71 1021 0.23 dpa 1020 10-9 10-8 10-7 10-6 Dose Rate (dpa/sec)
Effects of dose rate on dislocation evolution Network Loop 10 8 5.4 x 10⁻⁷ 6 dpa/sec Dislocation Density (x1014 m-2) 0.27 4 3.1 3.1 5.4 x 10⁻⁷ 0.27 2 dpa/sec 0.91 0.91 0.089 0.089 0 0 10 20 0 10 20 30 Cumulative Dose (dpa) • Loop line lengths seem to increase with dose below 10 dpa, and decrease thereafter, because of loop unfaulting and network dislocation formation above 10 dpa. • There seem to be little effect of dose rate on these remaining loop line lengths, because some loops at lower dose rate grow large enough to be unfaulted and become network dislocation.
Effects of dose rate on dislocation evolution Network Loop 10 8 5.4 x 10⁻⁷ 6 dpa/sec Dislocation Density (x1014 m-2) 0.27 4 3.1 3.1 5.4 x 10⁻⁷ 0.27 2 dpa/sec 0.91 0.91 0.089 0.089 0 0 10 20 0 10 20 30 Cumulative Dose (dpa) • The rate of network dislocation evolution is enhanced at lower dose rates, caused by the enhanced nucleation and growth of dislocation loops. • Therefore, the total dislocation density, which includes both network dislocations and loop line length is important to understand the dose rate effects on microstructural evolution in the higher dose region.
Fe-15Cr-16Ni, SA 408 - 444 ˚C Enhanced cavity nucleation at lower dose rates 2.0 At a given dose rate, cavity density increases with dose. 1.5 3.1 Cavity Density (x1022 m-3) 1.0 0.9 Both the absolute value and the rate of increase in cavity density are higher at lower dose rate. 387 ˚C 5.4 17 x 10-7 0.5 dpa/sec 7.8 0.27 0.089 390 ˚C 0 Low dose rates enhance cavity nucleation. 0 10 20 30 40 50 60 70 Cumulative Dose (dpa)
Effect of dose rate on cavity size distributionat 7.2 ± 0.8 dpa Cavity Density (x1021 m-3) Cavity Diameter (nm) • Larger cavities can be observed only at the lower dose rate, indicating that cavity growth is also enhanced at low dose rate. • A higher density of small cavities can be observed at the lower dose rate, indicating continuous operation of cavity nucleation.
Fe-15Cr-16Ni, SA 408 - 444 ˚C Average cavity diameter is not a good measure of dose rate effects 50 7.8 40 387 ˚C At similar cumulative dose levels, cavities with larger diameter caused by enhanced cavity growth at lower dose rate are offset by the small cavities caused by continuous cavity nucleation, resulting in little effect of dose rate on average diameter. 17 x 10-7 390 ˚C dpa/sec 30 Average Cavity Diameter (nm) 5.4 0.9 20 3.1 10 0.27 0.089 0 0 10 20 30 40 50 60 70 Cumulative Dose (dpa)
Interpretation of cavity size distribution 1 cycle irradiation 2 cycles irradiation 2.36 dpa, 0.91 x 10⁻⁷ dpa/sec 6.36 dpa, 0.91 / 2.1 x 10⁻⁷ dpa/sec Recent Cavities Earlier Cavities Cavity Density (x1021m-3) Cavity Diameter (nm) Recent cavities Cavities nucleated during the 2nd cycle of irradiation Earlier cavities Cavities nucleated during the 1st cycle of irradiation
Fe-15Cr-16Ni, SA 408 - 444 ˚C Enhanced cavity growth at lower dose rates 50 It is clearly observed that cavity growth is strongly enhanced at lower dose rates. At lower dose rate, accelerated dislocation evolution provides sufficient vacancies, resulting in enhancements of both cavity nucleation and growth. 387 ˚C 40 1.7 x 10⁻⁷ 390 ˚C dpa/sec 7.8 30 3.1 0.9 Diameters of “Earlier Cavities” (nm) 5.4 20 0.27 10 0.089 0 Earlier cavities 0 10 20 30 40 50 60 70 Cavities nucleated during the 1st cycle Cumulative Dose (dpa)
Effects of dose rate on swelling in ion-irradiated Fe-15Cr-16Ni 1.0 x 10⁻⁴ dpa/sec 4 MeV Ni3+ irradiation shows the dose rate effect operates at all temperatures. 4.0 x 10⁻⁴ dpa/sec 1.0 x 10⁻³ dpa/sec 300˚C 400˚C 500˚C 600˚C 101 100 Swelling (%) 10-1 10-2 10-3 10-1 100 101 10-1 100 101 10-1 100 101 10-1 100 101 102 Irradiation Dose (dpa)
Summary • Lower dose rate increases swelling by shortening the incubation dose for swelling. The incubation dose is proportional to dose rate. • The steady state swelling rate is not affected by the difference in dose rate. • Lower dose rate enhances network dislocation formation. This is caused by enhanced loop growth and unfaulting. • At lower dose rate, enhanced dislocation evolution increases sink strength of interstitials. This is the major reason to enhance cavity nucleation and growth at lower dose rate.