Download
1 / 1
30 likes | 181 Vues
Flow Characterization of a Liquid Micromixer. LEFT: Device mask for the micromixer. The top two reservoirs are connected to the bottom, output reservoir through a long, narrow channel. C. t 0. t 0 + Δ t. Δ x.

E N D
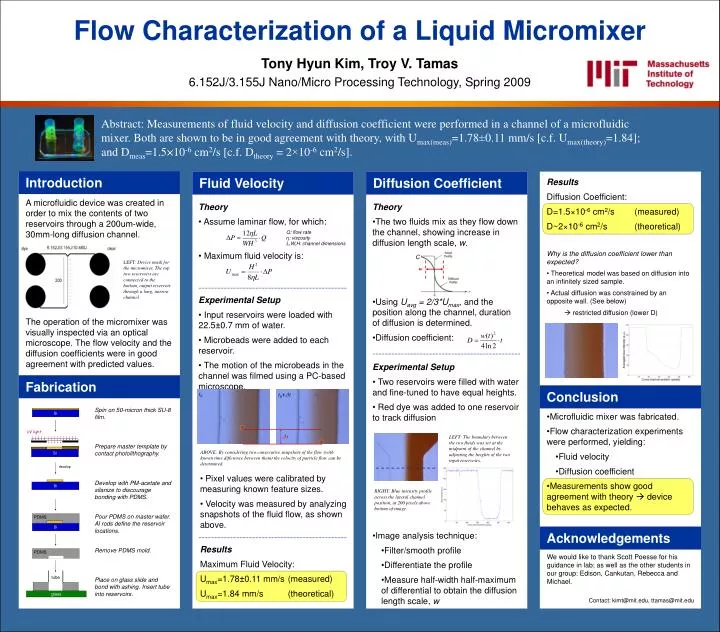
Flow Characterization of a Liquid Micromixer LEFT: Device mask for the micromixer. The top two reservoirs are connected to the bottom, output reservoir through a long, narrow channel. C t0 t0+Δt Δx ABOVE: By considering two consecutive snapshots of the flow (with known time difference between them) the velocity of particle flow can be determined. Tony Hyun Kim, Troy V. Tamas 6.152J/3.155J Nano/Micro Processing Technology, Spring 2009 Abstract: Measurements of fluid velocity and diffusion coefficient were performed in a channel of a microfluidic mixer. Both are shown to be in good agreement with theory, with Umax(meas)=1.78±0.11 mm/s [c.f. Umax(theory)=1.84]; and Dmeas=1.5×10⁻⁶ cm2/s [c.f. Dtheory = 2×10⁻⁶ cm2/s]. • Results • Diffusion Coefficient: • D=1.5×10⁻⁶ cm2/s (measured) • D~2×10⁻⁶ cm2/s (theoretical) • Why is the diffusion coefficient lower than expected? • Theoretical model was based on diffusion into an infinitely sized sample. • Actual diffusion was constrained by an opposite wall. (See below) • restricted diffusion (lower D) Introduction Fluid Velocity Diffusion Coefficient A microfluidic device was created in order to mix the contents of two reservoirs through a 200um-wide, 30mm-long diffusion channel. • Theory • Assume laminar flow, for which: • Q: flow rate • η: viscosity • L,W,H: channel dimensions • Maximum fluid velocity is: • Experimental Setup • Input reservoirs were loaded with 22.5±0.7 mm of water. • Microbeads were added to each reservoir. • The motion of the microbeads in the channel was filmed using a PC-based microscope. • Theory • The two fluids mix as they flow down the channel, showing increase in diffusion length scale, w. • Using Uavg = 2/3*Umax, and the position along the channel, duration of diffusion is determined. • Diffusion coefficient: • Experimental Setup • Two reservoirs were filled with water and fine-tuned to have equal heights. • Red dye was added to one reservoir to track diffusion • Image analysis technique: • Filter/smooth profile • Differentiate the profile • Measure half-width half-maximum of differential to obtain the diffusion length scale, w w The operation of the micromixer was visually inspected via an optical microscope. The flow velocity and the diffusion coefficients were in good agreement with predicted values. Fabrication Conclusion Spin on 50-micron thick SU-8 film. Prepare master template by contact photolithography. Develop with PM-acetate and silanize to discourage bonding with PDMS. Pour PDMS on master wafer. Al rods define the reservoir locations. Remove PDMS mold. Place on glass slide and bond with ashing. Insert tube into reservoirs. • Microfluidic mixer was fabricated. • Flow characterization experiments were performed, yielding: • Fluid velocity • Diffusion coefficient • Measurements show good agreement with theory device behaves as expected. Si UV light LEFT: The boundary between the two fluids was set at the midpoint of the channel by adjusting the heights of the two input reservoirs. Si develop • Pixel values were calibrated by measuring known feature sizes. • Velocity was measured by analyzing snapshots of the fluid flow, as shown above. • Results • Maximum Fluid Velocity: • Umax=1.78±0.11 mm/s (measured) • Umax=1.84 mm/s (theoretical) Si RIGHT: Blue intensity profile across the lateral channel position, at 200 pixels above bottom of image. PDMS Si Acknowledgements We would like to thank Scott Poesse for his guidance in lab; as well as the other students in our group: Edison, Cankutan, Rebecca and Michael. Contact: kimt@mit.edu, ttamas@mit.edu PDMS tube glass