Download
1 / 15
170 likes | 318 Vues
Metrics for quantification of influence on climate. Described in detail in the 2014 SAP report Will be available at the end of this year S imple parameters (a form of common currency) for comparing atmospheric gases for their climate effects. Ayite -Lo Ajovan , Paul Newman, John Pyle,

E N D
Metrics for quantification of influence on climate • Described in detail in the 2014 SAP report • Will be available at the end of this year • Simple parameters (a form of common currency) for comparing atmospheric gases for their climate effects Ayite-Lo Ajovan, Paul Newman, John Pyle, A.R. Ravishankara Co-Chairs, Science Assessment Panel Climate Metrics, OEWG Paris 2014
Atmospheric lifetime: Concept Infinitely long lifetime No loss, No recovery Longer t slower recovery Atmospheric concentration t Shorter stop faster recovery emission Time Assume that L is proportional to n. • Production determines how much accumulates. • The lifetime determines how rapidly the atmosphere is “cleansed.” • Atmospheric lifetime is also a metric Climate Metrics, OEWG Paris 2014
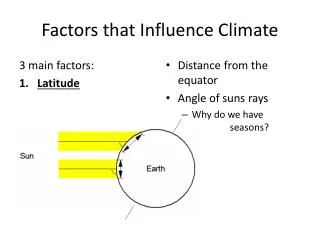
What is Greenhouse Effect? Earth Atmosphere • Greenhouse Gas (GHG) absorbs Infra Red (IR) radiation; heats surface (& lower atm) • Changes in GHG abundance change the energy balance - hence climate. • - How much? When? • Arrhenius predicted (over 100 years ago) that temperature would increase if CO2 increases. Climate Metrics, OEWG Paris 2014
What is Greenhouse Effect? Energy distribution governed by fundamental laws of physics CO2 Energy going out (proper units) Eout O3 Ein IR Wavelength • Clearly see absorption by CO2 and other greenhouse gases • Greenhouse effect is REAL! You can see it in the spectrum (Otherwise, earth would be a frozen planet!). • Adding gases traps more energy, but it takes time for the entire Earth Land-Atmosphere-Ocean system to warm. • Eventually the system comes to equilibrium Climate Metrics, OEWG Paris 2014
Radiative Forcing Earth Atmosphere Radiative Forcing is a metric Climate Metrics, OEWG Paris 2014
Radiative Forcing • Instantaneous change in the outgoing flux • A measure of what has happened… a look back • Does not account for time dependence of emission Atmosphere Earth Definition: Change in net irradiance at the tropopause (top of the radiative atm.) subsequent to a perturbationafter allowing for stratospheric temperatures to readjust to radiative equilibrium, but with surface and tropospheric temperatures and state held fixed at the unperturbed values RF (wm-2) is a direct measure of the extent to which the Earth’s energy budget is out of balance to stray away from its “normal” state. (Balance between incoming solar radiation and outgoing infrared radiation) RF is not measured for GHGs - it is calculated using input from basic lab measurements of the gases. Why use this?: DT = l x RF ; Positive RF – heating; Negative RF– cooling; a good measure of relative GHG contributions. Now extended to aerosols… Climate Metrics, OEWG Paris 2014
Global warming potential (GWP) Red: 15 yr. Blue- CO2: 5-200 yr. “lifetime” (from C- cycle modeling)… CO2 “lifetime” is comlex Radiative Forcing • 100 year GWP has become the coin for policy makers • The time horizon is a policy choice – not a scientific choice Area A Area CO2 Years since emission 20 100 CO2-eq emission = emissions (e.g., in metric tonnes) x GWP (100) Climate Metrics, OEWG Paris 2014
Global Warming Potentials (GWP) • Estimate of “time-integrated” radiative forcing for a species relative to that of the same mass of CO2 • Developed for the first IPCC assessment (Derwent, Rodhe, and Wuebbles, 1990)--- very similar to ODP! • Extensively used in national and international policy • GWPs are a relative measure of the total energy added to the climate system by a component in question relative to that added by CO2. • GWPs do not lead to equivalence with the temporal evolution of the temperature response or that of other climate variables. Climate Metrics, OEWG Paris 2014
Global Temperature Potential (GTP) Rate of decrease determined by property of Earth systmem Temperature Change DT(X) DT(CO2) t2 Years after emission t1 Blue = CO2 Red = gas w/ ~15 yr lifetime Climate Metrics, OEWG Paris 2014
Global Temperature change Potentials • A “temperature outcome” metric and does not give other climate responses. • An estimate of the relative temperature increase on a per unit mass of emissions basis due to emissions of a greenhouse gas relative to that due to CO2 emissions for the chosen time horizon (Shine et al., 2005) • First included in IPCC AR5. • Accounts for climate sensitivity and the exchange of heat between the atmosphere and the ocean, GTPs include physical processes that GWPs do not. • GTPs also incorporate extra uncertainties (compared to GWPs) by including the climate response in the analysis. • GTPs are somewhat sensitive to the specific climate model used to calculate them and also to the background scenario. Climate Metrics, OEWG Paris 2014
GTP vs. GWP • Similar trends • GTP ≈ GWP when lifetime roughly equal to, or greater than, 100 yrs. • GTP< GWP for shorter -lived substances Climate Metrics, OEWG Paris 2014
Summary • There are a number of metrics for measuring climate change due to emissions of a substance • Most common to date is Global Warming Potential (GWP) • The GWP time horizon is NOT determined by science; 100 year is the most commonly used time horizon. • There is rough correspondence between GWP and GTP. Higher GWP implies a higher GTP. Climate Metrics, OEWG Paris 2014
THANK YOU FOR YOUR ATTENTION Climate Metrics, OEWG Paris 2014
Extra slide Climate Metrics, OEWG Paris 2014
Factors that influence energy & hence climate Earth’s orbit around the sun Ocean (heat storage/circulation) Land processes and Ice-cover solar intensity Atmospheric Processes Timescales of changes that are of current interest…. Decadal to century timescales… Climate Metrics, OEWG Paris 2014