Download
1 / 57
570 likes | 892 Vues
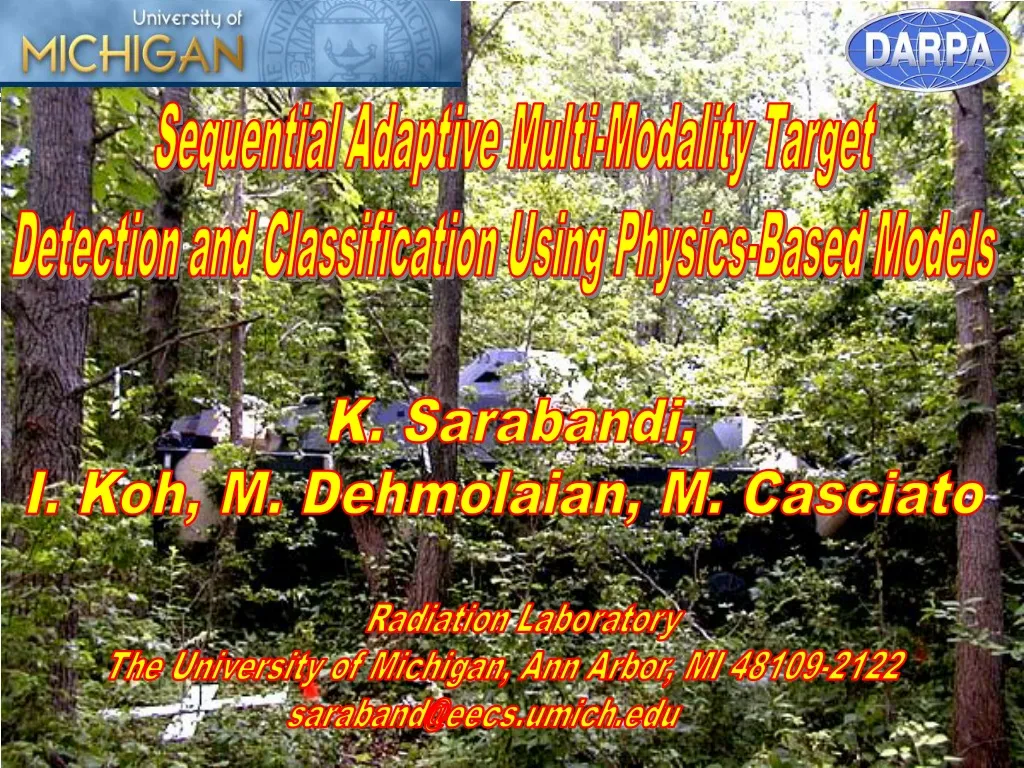
Sequential Adaptive Multi-Modality Target Detection and Classification Using Physics-Based Models. K. Sarabandi, I. Koh, M. Dehmolaian, M. Casciato. Radiation Laboratory The University of Michigan, Ann Arbor, MI 48109-2122 saraband@eecs.umich.edu. Outline: Motivation

E N D
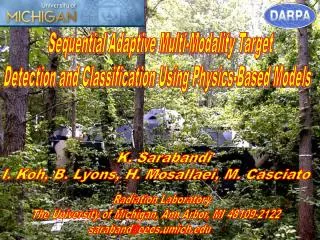
Sequential Adaptive Multi-Modality Target Detection and Classification Using Physics-Based Models K. Sarabandi, I. Koh, M. Dehmolaian, M. Casciato Radiation Laboratory The University of Michigan, Ann Arbor, MI 48109-2122 saraband@eecs.umich.edu
Outline: • Motivation • Detection of targets camouflaged under foliage using multi-frequency, -polarization, -incidence angle SAR/INSAR sensors. • Phenomenological study • Physics-based scattering and propagation modeling of clutter • Scattering models for targets under trees including interaction • High resolution SAR/INSAR image simulator • Time reversal methods for foliage camouflaged target detection • Simulation results • Iterative method • Forest channel estimation using frequency correlation function
Motivation • A reliable approach for detection and identification of targets camouflaged under foliage with an acceptable false alarm rate and probability of detection has not yet been developed. • Due to the complexity of the problem, i.e. • Signal attenuation, phase-front distortion, poor signal-to-clutter ratio, etc., single sensor approaches (optical, IR, radar) do not produce satisfactory results. • “Capable sensors” operating in diverse modality in conjunction with novel algorithms can drastically enhance FAR and PD. • Polarization diversity, Multi-frequency, Multi-static, Multi-incidence angle, Interferometric
UAV Phenomenological Study Physics-based Scattering and Propagation Modeling of Forest • Forest is a complex random medium composed of lossy scatterers arranged a semi-deterministic • Foliage cause significant attenuation, scattering, field fluctuation • Target is in the close proximity of many scatterers (strong field fluctuations and phase front distortion) • Signal level, fluctuations, polarization state, impulse response, spatial coherence etc. depend on: Tree density, type, height, and structure • Goal: • To develop an accurate EM model for forest stands to allow performance assessment of radar sensors and target detection algorithms.
rb ra Rough Interface Scattering Model for Forest Canopies • Scattering from discrete scatterers- Trunk: stratified dielectric cylinder- Branch: homogeneous dielectric cylinder- Leaf: dielectric disk or needle- Ground: layered dielectric half-space • Single Scattering is invoked • Four Scattering Mechanisms are included Attenuation rate NP/m
E i E s E d E r Phenomenological Study Observation Point in the Forest • Near-field calculation is required • Approximate analytical formulations for near-field scattering from branches and tree trunks are derive. • Coherent summation of scattered field from all tree components. (Coherence is important at S-band and lower) Single scattering theory Interaction among tree structures are ignored.
40 Ez Ez V/m V/m Severe distortion due to trees & Dispersion Time[ns] Time[ns] Simulation Results Time-domain Response Observation point is 1m above the ground inside a pine forest. v-pol. wave is incident at 40o, and BW 1GHz (1GHz – 2GHz). 15m Mean Field Direct Ground bounce
Simulation Results Backscattering Coefficient Red pine Tree height: 15.3 m, Crown Height: 9.5 m
Backscattering Specular direction Simulation Results Bistatic Scattering Response the Pine Forest Freq.: 1.25GHz (L-band), 10 pine trees, i = 45o, i = 0o, 100 realizations. qs Co-pol Cross-pol HH VV Backscatter Enhancement
Phenomenological Study Model Enhancement for High Frequencies • Standard method for the calculation of mean-field attenuation constant is based on single scattering theory (Foldy’s approximation), which is valid for sparse media. • Needles are placed very close to each other causing significant multiple scattering effects. • Inclusion of the effect of multiple scattering for dense foliage.
Measurement Setup at 35GHz • 13 pine trees occupying 15m ×25m • Rx/Tx: Ka-band (35GHz) horn antennas with 10o HPBW • Tx 20m away from tree stand, giving 3m ×3m footprint at the tree stand • Rx first set in front of tree stand for calibration, then moved behind tree stand • 84 independent spatial samples collected
Measurement Results • Histogram shows a close match to the exponential PDF. • More statistical samples needed to obtain more accurate PDF. Measurement: mean -24.8 dB, std. -23.8 dB Simulation: mean -33.1 dB, std. -32.3 dB • Single scattering model for pine trees is not accurate at millimeter wave frequencies. • To reduce the discrepancy, multiple scattering effects should be included. Note: Single scattering theory overestimates the attenuation.
Rayleigh-Gan Single scattering with MoM * Multiple scattering with MoM Shh Shh dB ~1dB ~1.5 dB i i Svv Svv ~1dB ~3dB i i Model Enhancement Multiple Scattering Effect of Needle Clusters • Forward scattering for two cluster structures. • Frequency: 35 GHz. • Average needle radius 0.6 mm, and length 3.5 cm; minimum distance between needles 5.5 mm. • Dense distribution of needles (~ 100/cluster). • Rayleigh-Gans approximation is invalid. Note: lower forward scattering lower attenuation rate.
Challenges: Application of MoM is impractical. • Required memory: > 500 MB for 6000 unknowns for 96 needles. • Time for inversion of MoM matrix: ~ 1 hour using 2.4 GHz dual processor Linux machine. Calculation time for scattered field from all needle clusters in one tree: ~ 15 min using pre-stored inverse MoM matrix. Forest simulation requires ~ 100 realizations for tens of trees. • Storage for bistatic S matrix: > 1 GB • Solution: Macro-modeling multiple scattering effects. • Macro-model of bistatic scattering from a needle cluster. • Shape of needle cluster is almost deterministic, can be treated as a dielectric block with effective permittivity to calculate near forward scattering. • Scattering power at directions far from forward scattering direction is much lower.
* * |<Shh>|2 |<Svv>|2 <|Shh|2> <|Svv|2> Rotation Outside forward scattering Forward scattering Macro-modeling Multiple Scattering from a Needle Clusters dB • Rotation angle around central stem is random: macro-model the averaging effect. • For scattering directions away from forward scattering direction, the scattered power level is much lower and the phase of S parameters is random, <|S|2> can be modeled as a constant and <S> can be given a random phase. • At near forward scattering, S parameters determined by the effective dielectric structure, which can be modeled by using DBA (Distorted Born Approximation). Fwd. Scat. Cone s [degrees]
A r’ L i (r’) eff Double Cone L s (r’) B eff Concave Cylinder Analytical Computation of Mean Field Using DBA • Shape of dielectric block is a body of revolution determined by the shape of the cluster. • Incident field is attenuated by the effective dielectric block during path Li(r), then scattered by the local differential volume with effective permittivity. • Effective permittivity is calculated based on dielectric mixing formula, could be inhomogeneous due to different needle density at different locations.
a a Mie Mie --- DBA * DBA Validity Region of DBA: comparison with known solutions |S|2 S dB degrees k0a k0a • Forward scattering of a dielectric sphere (r=1.5+j0.5) with radius a versus size factor k0 a, where k0 is free space wave number. • DBA compared with Mie solution: < 0.5 dB error in scattered power up to k0 a = 50; < 2o phase difference for most k0 a.
z h1 rc(xc, yc, zc) y h2 0 Effective Permittivity Calculation Using Dielectric Mixing Formula • Inhomogeneous needle density : • Clausius-Mossotti dielectric mixing formula: where, h is the permittivity of background medium, is the polarizability tensor averaged over orientation angles, and
s DBA Macro-model Compared with Monte-Carlo Simulation Using MoM: Bistatic Pattern Shh Svv • Bistaticscattering (normal incidence) of a needle cluster consisting of 96 needles versus scattered angle s,averaged over the self-rotation angle. • DBA compared with MoM (multiple scattering) simulation results: pattern and phase matched well for the main lobe.
Multiple Scattering Model Compared with Measured Results Note: • Rayleigh-Gans approximation is invalid at millimeter-wave frequencies. • Multiple scattering model improves the simulation result by 7 dB. Note: Multiple scattering simulation takes ~1600s, about 30% faster than RG simulation (~2300s).
Near grazing New Model for Broad Leaves • Motivation • Thin dielectric disks are used to model broad leaves for deciduous trees. • Two approximate solutions, Rayleigh-Gans & VIPO are not valid for the entire region of interest like frequency, size, observation direction. • A new scattering model is developed.
z i r= 26.6 + i11.56 0.2mm Circular disk x Forward scattering f = 10GHz f = 20GHz Examination of Two Approximate Solutions Note: VIPO doesn’t include diffraction from edge. From this point diffraction becomes dominant.
Plane wave z i t x a If thickness (t) is very small, IE decouples term can be easily evaluated. Rayleigh-Gans PO current New Formulation for Scattering from Thin Dielectric Disk Note: Current (J) can be approximated as a function of only (x,y), and constant w.r.t. z.
Taking Fourier transform w.r.t (x,y) & using mid-point rule w.r.t. z To obtain explicit current expression, taking Fourier transform again w.r.t (x,y) For Far-field,
Freq.: 10GHz r= 26.6 + i11.56 z i 0.2mm x < 0.2dB 4o Circular Dielectric Disk Forward scattering
4o < 0.2dB Circular Dielectric Disk (Continued) Freq. = 20GHz
Scattering Models for Targets Under Trees • Challenges • Hard targets and clutter constitute a computationally very large problem. • Target and clutter are structurally complex (features vary from small to very large objects). • Requirements • Accurate estimation of scattering from various type of forest & target for a wide bandwidth. • Statistical description of scattering for signal processing applications.
Proposed Approaches: • Low frequencies (f<100 MHz): brute force Full-wave methods can be used (FDTD, FMM, FEM) • Scattering from foliage can be ignored • Mid-frequency range (100 MHz<f<1 GHz): Hybrid FDTD and single scattering forest code • Near-field interaction between foliage and target are included. • High frequency (f>1GHZ): Hybrid PO and improved forest code • Near-field interaction between foliage and target are included. • Iterative PO for target
h-pol. or v-pol. including all interactions Hybrid FDTD/forest model • Using the coherent forest model, calculate the fields on an FDTD boundary given in the proximity of target. 2. Using FDTD, compute the scattered fields from the target on the same grid.
Hybrid FDTD/forest model Observation point exchanging Source point • To calculate the effect of the forest on the scattered field, apply the reciprocity theorem. • So source & observation are exchanged. Note: Using this procedure, interaction between forest & target is inherently taken into account.
attenuation dispersion attenuation Forest Response at Low Frequencies Frequency: 30MHz – 100MHz 10 trees are considered. Dielectric constants: 21.7 + i14.6 for branch 9.8 + i1.7 for ground. Height of tree: 15m, Diameter of trunk: 22cm. 45o Incidence angle. Note: Effect from trees is can be ignored.
z Ei x 400 y Bistatic Scattering from HUMVEE Discretized HUMVEE for FDTD Analysis Note: Scattering from target is much larger than that from forest at low frequency band.
Observation plane Field Distribution H-Pol, f=180 V-Pol, f=180 Freq. = 1GHz 10 pine trees. Dimension of the plane = 5 3m. Height of the plane = 1m. f=185 Note: Due to multi-path, field distribution on the plate is very sensitive to incidence angle at high frequency range.
High-frequency Model • Calculate scattering from the target inside a forest using PO approximation • Valid for targets large compared to l • Valid near specular directions where scattering amplitude is large. • Forest scattering at high frequencies is very significant, hence the target is illuminated from all directions. • Independent of observation point there will be many specular contributions. • Process: • Calculation of field distribution on the scatterer using the coherent forest model. • Based on these calculated fields derive PO currents on the target. • Apply the reciprocity theorem to calculate scattered field from the target that includs the effects of trees.
PEC Ground Poynting vector PO solution Reciprocity approach recovers the ground effects PO current Note: 4-rays Model
Metal plate Backscattering Calculation based on Reciprocity Theorem Freq. : 2GHz Size: For free space With ground plane
Observation line One source Validity of PO Solution Freq. = 10GHz Radius of disks = 2cm r = 26.6 + i11.56 i = 31.22o, i = 258.8o Discrepancy s [Degrees] s [Degrees]
forward direction PO approximation is very accurate for two directions. Specular direction Observation point Wave is incident on scatterers in every directions. At any observation point, specular scattering from scatterers in the medium may be dominant. scatterer PO approximation can estimate the scattered field with good accuracy. PO Approximation inside Random Medium In a random medium
Source positions & polarization Random wave vector & orientation s [Degrees] s [Degrees] Validation of PO Solution (Cont’d) 2000 sources (plane wave) around scatterer Note: PO estimates scattering accurately over a wide range.
Simulation range Plate in forest Plate in forest s0 of forest s0 of forest Plate without forest Plate without forest Target inside Foliage: Co-pol. Freq.: 2GHz 4 realizations, 10 pine trees with 15m height plate 1m above ground plane
Target inside Foliage : Cross-pol. s0 of forest s0 of forest Plate in forest Plate in forest
Note: Field Distribution on Plate Freq.: 2GHz, 10 pine trees 3 3 plate, /4 sampling points
Time Reversal Methods • Preliminary study using the coherent foliage model • Point-to-point secure communication using TRM • Achieving super-resolution focusing through proper use of multi-path. Region of influence Region of influence Transmit array Highly scattering random medium • Procedure: • transmit from receiver and measure amplitude, phase, and polarization at the array points • transmit from the array elements with matched polarization and amplitude but conjugate the phase.
Foliage camouflaged target detection using TRM • Due to scattering and attenuation, wave phase front is distorted. Conventional SARs’ point spread function is smeared. SAR track Multi-path, attenuation, fading, etc. Beam pattern is broaden or lost. • Application of TRM using a recursive method in conjunction with a first-order channel estimation
30 trees 15m 6m 1m 17 elements Super resolution Point-to-point secure communication • Array in the forest, observation point outside 60 deg. from normal. • The antenna is a 17-element array with 1l spacing and in cross configuration • Simulation is done at 10 GHz • TRM produces a beam with 0.5deg. beamwidth • element spacing could be increased with no grating lobes Array beam without foliage
SAR Simulation Focusin beam inside foliage using time reversal method Assume a fictitious source • Excite fictitious source on ground through forest (determine Green’s function of medium) • Complex conjugate & reradiate the signal through foliage (using reciprocity theorem). • Due to channel, fading, multipath, forest will act as a lens to focus energy at the fictitious source point.
0.05T/m2 30 Trees 10 dB 1 Km 3 dB
Array Distribution for a Polarimetric SAR That can Focus Inside the pine Forest Amplitude distribution Phase distribution
Iterative TRM I(x,y)= L S(u,t) S’(u,t)= L –1I’(x,y) Phase conjugate the array Array distribution Reprocess This process may not converge
Objective: First order approximation removal of foliage effects from target response (undo attenuation, remove volume scattering) preconditioning R 0 Near Far Range Range Forest Channel Estimation Using Frequency Correlation Function • Need to retrieve: • Tree structure (height, density) • Attenuation profile • Volume scattering L C Side-looking SARs can’t directly provide target vertical struvture Np/m