Download
1 / 18
180 likes | 300 Vues
Visualization as a Science Discovery Tool Issues and Concerns. Kelly Gaither Director of Visualization/ Sr. Research Scientist Texas Advanced Computing Center September 8, 2011. Issues and Concerns Maximizing Scientific Impact Managing Data at Scale Providing Resources at Scale

E N D
Visualization as a Science Discovery ToolIssues and Concerns Kelly Gaither Director of Visualization/ Sr. Research Scientist Texas Advanced Computing Center September 8, 2011
Issues and Concerns • Maximizing Scientific Impact • Managing Data at Scale • Providing Resources at Scale • Ensuring Broad Accessibility/Developing Ubiquitous Tools
Visualization Mantra “The purpose of computing is insight not numbers.” -- R. W. Hamming (1961) “The purpose of visualization is insight not pictures.” -- Ben Schneiderman (2005)
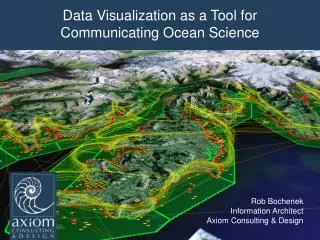
Maximizing Scientific Impact Image: Greg P. Johnson, Romy Schneider, TACC Image: Adam Kubach, Karla Vega, Clint Dawson Greg Abram, Carsten Burstedde, Georg Stadler, Lucas C. Wilcox, James R. Martin, Tobin Isaac, Tan Bui-Thanh,and Omar Ghattas Image: Karla Vega, Shaolie Hossain, Thomas J.R., Hughes
Managing Data at Scale Pixels Large-Scale Visualization Resource HPC System Display Mouse Data Archive Wide-Area Network Remote Site Local Site
Where Does Technology Fit In? • We have always used technology to create visualizations of what we see in our minds eye. • What changes over time is the technology we use to do the visualization.
LonghornFirst NSF XD Visualization Resource 256 Nodes, 2048 Cores, 512 GPUs, 14.5 TB Memory • 256 Dell Dual Socket, Quad Core Intel Nehalem Nodes • 240 with 48 GB shared memory/node (6 GB/core) • 16 with 144 GB shared memory/node (18 GB/core) • 73 GB Local Disk • 2 Nvidia GPUs/Node (FX 5800 – 4GB RAM) • ~13.5 TB aggregate memory • QDR InfiniBand Interconnect • Jobs launched through SGE • ~6GB/s to scratch filesystem • ~6GB/s to Ranger filesystem Kelly Gaither (PI), Valerio Pascucci, Chuck Hansen, David Ebert, John Clyne (Co-PI), Hank Childs
Hadoop on LonghornPI: Weijia Xu (UT LIFT Grant) • Local Storage Expansion • 192 500GB 7.2k drives are installed on 48 R610 nodes on Longhorn (96 usable TB) • 112 146GB 15k drives are installed on 16 R710 nodes on Longhorn. (16 usable TB) • /hadoop file system • Went in to production December 2010 • 6 early user projects(text mining and information retrieval) • 142k core hours from Dec to Feb
Longhorn Usage Modalities: • Remote/Interactive Visualization • Highest priority jobs • Remote/Interactive capabilities facilitated through VNC • Run on 3 hour queue limit boundary • GPGPU jobs • Run on a lower priority than the remote/interactive jobs • Run on a 12 hour queue limit boundary • CPU jobs with higher memory requirements • Run on lowest priority when neither remote/interactive nor GPGPU jobs are waiting in the queue • Run on a 12 hour queue limit boundary
Longhorn Queue Structure Example: qsub -q normal -P vis
Software Available on Longhorn • Programming APIs: OpenGL, vtk (Not natively parallel) • OpenGL – low level primitives, useful for programming at a relatively low level with respect to graphics • VTK (Visualization Toolkit) – open source software system for 3D computer graphics, image processing, and visualization • IDL • Visualization Turnkey Systems • VisIt – free open source parallel visualization and graphical analysis tool • ParaView – free open source general purpose parallel visualization system • VAPOR – free flow visualization package developed out of NCAR • EnSight – commercial turnkey parallel visualization package targeted at CFD visualization • Amira – commercial turnkey visualization package targeted at visualizing scanned medical data (CAT scan, MRI, etc..)
Longhorn Visualization Portalportal.longhorn.tacc.utexas.edu • Developed to provide easy access to Longhorn and abstract away complexities involved with command line access • Leverages TeraGrid user portal codebase and employs a fraction of TGUP developers to ensure continuity • Used for all in-person Longhorn training
Longhorn Visualization Portalportal.longhorn.tacc.utexas.edu >3000 jobs submitted through the portal
Longhorn Visualization Portalportal.longhorn.tacc.utexas.edu • Specify type of session • Specify resolution of vnc session • Specify number of nodes needed and the wayness of the nodes • Provides graphic of machine load
Longhorn Visualization Portalportal.longhorn.tacc.utexas.edu • Vnc session opens up in java enabled browser • Behaves as if user had gotten a remote desktop into Longhorn.
EnVisionGreg Johnson, Brandt Westing • Web-based visualization software that allows researchers to develop interactive visualizations intuitively. • Currently integrated into the Longhorn Visualization Portal but can run independently. • Began collaborations with ParaView team.
Summary • Close collaborations with the science partners are key • User support • Minimize data transfers if possible • Data stays in single location • Scale resources effectively based on use cases • Easy accessibility to and interaction with technologies encourages diverse communities participation