Download
1 / 23
230 likes | 234 Vues
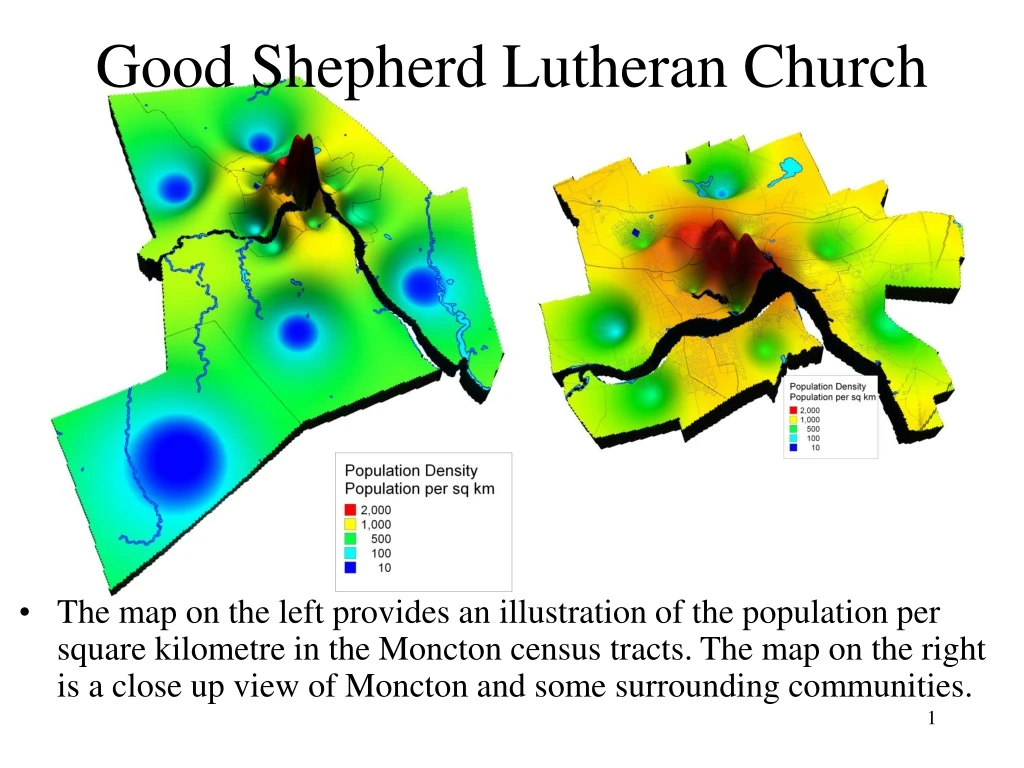
Good Shepherd Lutheran Church. The map on the left provides an illustration of the population per square kilometre in the Moncton census tracts. The map on the right is a close up view of Moncton and some surrounding communities. Moncton’s Population.

E N D
Good Shepherd Lutheran Church • The map on the left provides an illustration of the population per square kilometre in the Moncton census tracts. The map on the right is a close up view of Moncton and some surrounding communities.
Moncton’s Population • The map on the right provides a three dimensional view of the population counts in each of the census tracts. • The map on the right provides a three dimensional view of the population density.
2006 Population • The communities listed above give the opportunity to compare Monkton’s population with other similar communities. • Moncton makes up 13.2% of the communities examined. • Moncton grew by 7.4% between 2001 and 2006. When compared to the other communities Moncton had the largest growth.
Population Change • The population of Moncton has grown by 7.4% This is above the provincial average of 0.1% and the national average of 5.4%.
Moncton's Population Change • The population of Moncton has increased by 7.4%. • Between 2006 and 2001 the number people between the age of 55 and 64 has increased by 35.9%. The number of children between the age of 5 and 9 has declined by 2.8% and the number of adults between the age of 35 and 39 has decreased by 9.3%.
Population by Age Group • When compared to similar communities, Saint John has the highest percentage of children age 0 to 14 (17.4%). • Halifax has the highest percentage of those between the age of 30 and 49 (31.5%). • Chicoutimi has the largest percentage of seniors (15.4%).
Median Age • 13.7% of Moncton’s population is over the age of 65. • The rural areas surrounding Moncton have older populations.
Marital Status • Moncton and the province of New Brunswick have the highest percentage of individuals who are separated but still legally married (3.7%). • In Moncton the percentages of those who have never been married and those who are legally married are very similar to the national average. • There are fewer divorced individuals in the Maritimes.
Household Size • Households in Moncton tend to be smaller. 21.6% of households in Moncton have 4 or more people. By comparison in New Brunswick 23.5% of households have 4 or more people and in Canada 25.4% of household have 4 or more people.
Children Living at Home • 71% of children living at home in Moncton are under the age of 18. • The average number of children living at home in Moncton is 1.0. This is lower than in any other communities examined. • There are12,505 children between the age of 6 and 14 living in Moncton.
Housing • 63.1% of homes in Moncton are single detached homes. This is lower than in the province of New Brunswick where 80% of the population live in single detached homes but it is greater than all of the other communities examined.
Renting and Owning Patterns • 68.6% of households in Moncton own their home. • 74.7% of households in New Brunswick own their home. • 65.7% of households in Canada own their home.
Renting and Owning • Household finances can be difficult if 30% or more of the household income is spent on the rent or mortgage payments. • 40% of renters in Moncton are spending more that 30% of their household income on rent. • 13% of owners are spending more than 30% of their household income on mortgage payments.
Income • Household income in Moncton is higher than that of New Brunswick but below that of Canada. • The incidence of low income in Moncton is lower than all of the other communities. • Moncton’s unemployment rate is lower most of the other communities.
Income by Family Type • Lone parent families have the lowest income of all families. • Lone parent families in Moncton have the highest income of all of the municipalities considered but they are below the national average.
Source of Income • 75.3% of the residents of Moncton receive their income from employment. This is a higher percentage than in New Brunswick but lower than in Canada.
Labour Force • In Moncton the number of Management and Professional employees has increased by 144%. • 12% of Moncton’s labour force are employed in Retail, 11% in Health and 11% in Management
Education • 61% of the population of Moncton has more than High School graduation. • In Canada 59% of the population have more than High School Graduation and in New Brunswick 52% have more than High School Graduation.
Visible Minorities • 1.3% of the residents of Moncton belong to a visible minority. • 11.8% of Canadians belong to a visible minority. • In Moncton blacks are the largest (0.6%) visible minority.
Immigration • 3% of Moncton’s population are immigrants. • Between 1996 and 2001 400 immigrants settled in Moncton. This is 0.3% of the population. • 18% of Canada’s population are immigrants.
Religious Affiliation - 2001 • Lutherans made up 0.2% of the population of Moncton in 2001. 2.2% of Canadians are Lutheran. • Non Christian and No Religion make up 9.9% of the population in Moncton. 23.6% of Canadians are Non Christian or have No Religion.
No Religion • Those who claim no religious affiliation in Moncton make up 8.6% of the population. This map provides an indication of where these people are located.
Religious Affiliation • Statistics Canada indicates that in 2001 there were 200 people in Moncton who said they were Lutheran. • 11,185 people in Moncton are non Christian or have no religious affiliation.