Download
1 / 26
260 likes | 384 Vues
FOR INVESTORS. Maintaining perspective in volatile markets. Not FDIC Insured May Lose Value No Bank Guarantee. Importance of avoiding the emotional roller coaster. GREED. Exhilaration. Apprehension. Enthusiasm. Enthusiasm. Panic. Confidence. Confidence. Cheer. Dejection. Hope.

E N D
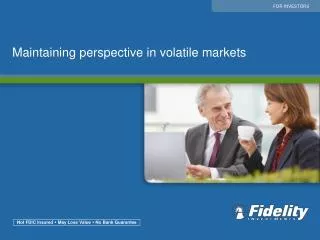
FOR INVESTORS Maintaining perspective in volatile markets Not FDIC Insured May Lose Value No Bank Guarantee
Importance of avoiding the emotional roller coaster GREED Exhilaration Apprehension Enthusiasm Enthusiasm Panic Confidence Confidence Cheer Dejection Hope FEAR
Global events can affect our emotions Middle East and North Africa remain volatile Debt crisis lingers in the U.S. and Europe Afghan war now longest in U.S. history Global terrorism on the rise
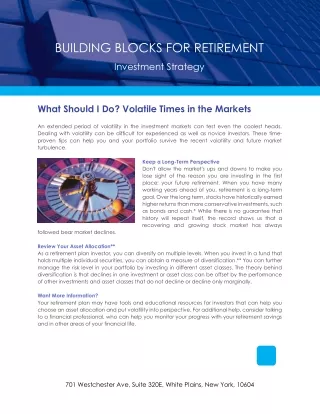
Economic events – and headlines – can seem even worse U.S. economy sees worst downturn since Great Depression S&P downgrades U.S. debt for the first time in history U.S. deficit seems out of control 4
“The only thing we have to fear, is fear itself.” – Franklin Delano Roosevelt Source: Morey Engle, The Harry M. Rhoads Photograph Collection, Denver Public Library.
In the short term, markets can go in 3 directions Move down Remain flat Move up
Long term, the market trend has been up $300,000 $250,000 $200,000 $150,000 $100,000 $50,000 $0 12/06 12/08 12/10 7/11 12/04 12/82 12/84 12/86 12/88 12/90 12/92 12/94 12/96 12/98 12/00 12/02 12/80 Historical growth of the S&P 500® Index, January 1980–July 2011. Initial investment of $10,000. Returns include the reinvestment of dividends and other earnings. This chart is for illustrative purposes only and does not represent actual or future performance of any Fidelity fund. Past performance is no guarantee of future results. All market indices are unmanaged. It is not possible to invest directly in an index. See end of presentation for index definitions.
Sudden events can disrupt the long-term view Dot-com bubble bursts Iraq War World Trade Center bombing Iraq invades Kuwait Black Monday Start of S&L crisis $300,000 Global financial crisis $250,000 9/11 $200,000 $150,000 $100,000 $50,000 $0 12/06 12/08 12/10 7/11 12/04 12/82 12/84 12/86 12/88 12/90 12/92 12/94 12/96 12/98 12/00 12/02 12/80 Historical growth of the S&P 500 Index, January 1980–July 2011. Initial investment of $10,000. Returns include the reinvestment of dividends and other earnings. This chart is for illustrative purposes only and does not represent actual or future performance of any Fidelity fund. Past performance is no guarantee of future results. All market indices are unmanaged. It is not possible to invest directly in an index. See end of presentation for index definitions.
History is not repeating itself The situation has markedly improved since 2008: • Corporate balance sheets are stronger • Corporate profits are robust • Banks are better capitalized • Interest rates are starting low and staying low • Leading economic indicators are improving 9
How often does the market move by at least 10%? 250% 200% 150% 100% 34% 50% 0% -20% -50% Average loss Average gain Average frequency: once a year Average period of loss: 102 days Average period of gain:223 days Source: Ned Davis Research, 2/20/28–8/22/11. Bull and bear markets defined as -10/+10% reversals in the S&P 500 Index. Past performance is no guarantee of future results. All market indices are unmanaged. It is not possible to invest directly in an index. Index performance is not meant to represent that of any Fidelity mutual fund. See end of presentation for index definitions.
How often does the market move by at least 20%? Average frequency: once every 3 ½ years Average period of loss:299 days Average period of gain:885 days 250% 200% 150% 101% 100% 50% 0% -36% -50% Average loss Average gain Source: Ned Davis Research, 2/20/28–8/22/11. Bull and bear markets defined as -20/+20% reversals in the S&P 500 Index. Past performance is no guarantee of future results. All market indices are unmanaged. It is not possible to invest directly in an index. Index performance is not meant to represent that of any Fidelity mutual fund. See end of presentation for index definitions.
How often does the market move by at least 30%? Average frequency: once every 6 years Average period of loss:497 days Average period of gain:1,887 days 247% 250% 200% 150% 100% 50% 0% -50% -48% Average loss Average gain Source: Ned Davis Research, 2/20/28–8/22/11. Bull and bear markets defined as -30/+30% reversals in the S&P 500 Index. Past performance is no guarantee of future results. All market indices are unmanaged. It is not possible to invest directly in an index. Index performance is not meant to represent that of any Fidelity mutual fund. See end of presentation for index definitions.
Periods of gains are longer and stronger than periods of decline
Most recent rebound has been strong as well 83.6% Dow Jones Industrial Average 108.6% NASDAQ 91.2% S&P 500 Index 90.6% International stocks 146.9% Emerging markets Cumulative returns from market bottom of recent recession Source: FMRCo, 3/9/09-12/31/10.U.S. stock market returns are represented by total return of Dow Jones Industrial Average, NASDAQ and S&P 500 Index. International stocks and emerging markets are represented by MSCI® EAFE® and MSCI Emerging Markets, respectively. Past performance is no guarantee of future results. All market indices are unmanaged. It is not possible to invest directly in an index. Index performance is not meant to represent that of any Fidelity mutual fund. See end of presentation for index definitions.
Trying to time the market can be costly 6.4% 5.4% 3.7% Average annual returns for stocks for 30-year period ending 6/30/11 8.0% 8% 6% 4% 2% 0% Missing 0 days By missing 5 best days By missing 10 best days By missing 20 best days Source: FactSet, 6/30/81–6/30/11.Stock returns represented by total return of the S&P 500 Index. Past performance is no guarantee of future results. All market indices are unmanaged. It is not possible to invest directly in an index. Index performance is not meant to represent that of any Fidelity mutual fund. See end of presentation for index definitions.
Staying the course has been a solid strategy Decline After 6 months After 12 months Stocks have rebounded within a year of decline 60% 40% 20% 0% -20% -40% -60% 1/73–9/74 1/77–2/78 12/80–7/82 9/87–11/87 6/90–10/90 7/98–8/98 4/00–9/02 11/07–3/09 Source: Morningstar EnCorr. Stocks are represented by the S&P 500 Index. Past performance is no guarantee of future results. All market indices are unmanaged. It is not possible to invest directly in an index. Index performance is not meant to represent that of any Fidelity mutual fund. See end of presentation for index definitions.
63.8% 51.2% 25.8% Investors who kept investing have seen more gains since 2008 Average account balance growth for continuous investors 80% 60% 40% 20% 0% Did not stop investing Stopped investing and did not restart Stopped investing and subsequently restarted Fidelity Workplace defined contribution data based on nearly 20,500 recordkept plans and more than 11.6 million recordkept participants as of June 30, 2011. Average account balance growth for continuous participants from 9/30/08 through 6/30/11. The analyses exclude tax-exempt accounts and nonqualified plans, but include participant and plan data from the Fidelity Advisor 401(k) Program. · Column 1: 25.8% represents 49,900 participants. Column 2: 51.2% represents 76,900 participants. Column 3: 63.8% represents 3.1 million participants. Past performance is no guarantee of future results.
Systematic investing can contribute to your growth potential $588,032 $352,819 $117,606 $600,000 $500/month $300/month $100/month $500,000 $400,000 $300,000 $200,000 $100,000 $0 5 years 10 years 15 years 20 years 25 years 30 years Hypothetical value of investments over time Dollar cost averaging does not ensure a profit or protect against loss in a declining market. For the strategy to be effective, you must continue to purchase shares in both up and down markets. · Hypothetical examples assume a beginning plan account balance of $0; monthly pre-tax contributions of $500, $300, and $100 for 30 years; and an effective annual rate of return of 7%. Ending values do not reflect taxes, fees, or inflation. If they did, amounts would be lower. · Past performance is no guarantee of future results. Performance is not meant to represent that of any Fidelity mutual fund. See end of presentation for index definitions.
“The key to making money in the stock market is not to get scared out of it." – Peter Lynch
Market returns have been much more powerful than cash Average annual returns: 1981–2010 10.7% 12.0% 9.7% 10.0% 8.5% 8.0% 5.1% 6.0% 3.2% 4.0% 2.0% 0.0% Inflation Bonds International stocks U.S. stocks Cash and equivalents Source: Morningstar EnCorr 2011. This chart represents the average annual return percentage for the investment categories shown for the 30-year period of 1981–2010. Returns include the reinvestment of dividends and other earnings. This chart is for illustrative purposes only and does not represent actual or implied performance of any investment option.Inflation, cash and equivalents, bonds, international stocks, and U.S. stocks are represented by the Consumer Price Index (CPI), Ibbotson U.S. 30-Day T-Bill Index, the Ibbotson U.S. Intermediate Government Bond Index, MSCI EAFE, and the S&P 500 Index, respectively. Past performance is no guarantee of future results. All market indices are unmanaged. It is not possible to invest directly in an index. See end of presentation for index definitions.
Diversification is an effective investment approach Source: FMRCo, 12/31/01–12/31/10.Diversification does not ensure a profit or guarantee against a loss.Bonds, high yield bonds, short-term investments, small-cap stocks, large-cap stocks, and international stocks are represented by the Barclays Capital U.S. Aggregate Bond Index, BofA Merrill Lynch U.S. High Yield Master II Index, Ibbotson U.S. 30-Day T-Bill Index, Russell 2000® Index, S&P 500 Index, and MSCI EAFE Index, respectively. Past performance is no guarantee of future results. All market indices are unmanaged. It is not possible to invest directly in an index. Index performance is not meant to represent that of any Fidelity mutual fund. See end of presentation for index definitions.
What have we learned? • Since 2008 the details have changed, but the conclusions remain the same. • Some tactical adjustments to your portfolio may be in order. • Moving entirely to cash has been costly, while staying inthe market has paid off. 22
Meet with your advisor and go over your plan • Review whether your financial picture has changed • Discuss your risk tolerance and investment horizon • Determine whether your portfolio is appropriately diversified • Invest regularly • Set up ongoing meetings with your advisor
Maintain your confidence GREED Exhilaration Apprehension Enthusiasm Enthusiasm Panic Confidence Confidence Cheer Dejection Hope FEAR
Important information Index definitions Standard & Poor's 500 Index (S&P 500) is an unmanaged market capitalization-weighted index of 500 widely held U.S. stocks and includes reinvestment of dividends. Dow Jones Industrial Average (DJIA) is an unmanaged average of common stocks comprised of major industrial companies and assumes reinvestment of dividends. NASDAQ Composite Index is an unmanaged market capitalization-weighted index that is designed to represent the performance of the National Market System which includes stocks traded only over-the-counter and not on an exchange. MSCI EAFE (Europe, Australasia, Far East) Index is an unmanaged market capitalization-weighted index that is designed to represent the performance of developed stock markets outside the United States and Canada. MSCI Emerging Markets Index is an unmanaged market capitalization-weighted index of equity securities of companies domiciled in various countries. The index is designed to represent the performance of emerging stock markets throughout the world and excludes certain market segments unavailable to U.S. based investors. Consumer Price Index, (CPI) is a widely recognized measure of inflation, calculated by the U.S. government. Ibbotson U.S. 30-Day T-Bill Index is an unmanaged unweighted index which measures the performance of one-month maturity U.S. Treasury Bills. Each month a one-bill portfolio containing the shortest-term bill having not less than one month to maturity is constructed. To measure holding period returns for the one-bill portfolio, the bill is priced as of the last trading day of the previous month-end and as of the last trading day of the current month. Ibbotson U.S. Intermediate Government Bond Index is an unmanaged market value-weighted index of U.S. government fixed-rate debt issues with maturities between one and 10 years. Barclays Capital U.S. Aggregate Bond Index is an unmanaged market value-weighted performance benchmark for investment-grade fixed-rate debt issues, including government, corporate, asset-backed, and mortgage-backed securities, with maturities of at least one year. Russell 2000 Index is an unmanaged market capitalization-weighted index of the stocks of the 2,000 smallest companies included in the 3,000 largest U.S.-domiciled companies. BofA Merrill Lynch U.S. High Yield Master II Index is an unmanaged index that tracks the performance of below investment grade U.S. dollar-denominated corporate bonds publicly issued in the U.S. domestic market.
Important information Not NCUA or NCUSIF insured. May lose value. No credit union guarantee. Past performance is no guarantee of future results. All market indices are unmanaged. It is not possible to invest directly in an index. Index performance is not meant to represent that of any Fidelity mutual fund. Stock markets, especially foreign markets, are volatile and can decline significantly in response to adverse issuer, political, regulatory, market, or economic developments. The securities of smaller, less well-known companies can be more volatile than those of larger companies. Foreign securities are subject to interest rate, currency exchange rate, economic, and political risks, all of which are magnified in emerging markets. In general the bond market is volatile, and fixed-income securities carry interest rate risk. (As interest rates rise, bond prices usually fall, and vice versa. This effect is usually more pronounced for longer-term securities.) Fixed-income securities also carry inflation, credit, and default risks for both issuers and counterparties. Unlike individual bonds, most bond funds do not have a maturity date, so holding them until maturity to avoid losses caused by price volatility is not possible. Lower-quality bonds can be more volatile and have greater risk of default than higher-quality bonds. Third-party trademarks and service marks are the property of their respective owners. All other trademarks and service marks are the property of FMR LLC or an affiliated company. Before investing, consider the funds' investment objectives, risks, charges, and expenses. Contact your investment professional or visit advisor.fidelity.com for a prospectus or, if available, a summary prospectus containing this information. Read it carefully. FIDELITY INVESTMENTS INSTITUTIONAL SERVICES COMPANY, INC., 100 SALEM STREET, SMITHFIELD, RI 02917 508021.6.0 1.908564.1010911