1 / 1

Normalized spectrum count

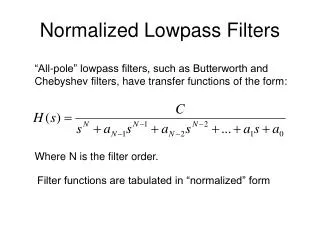
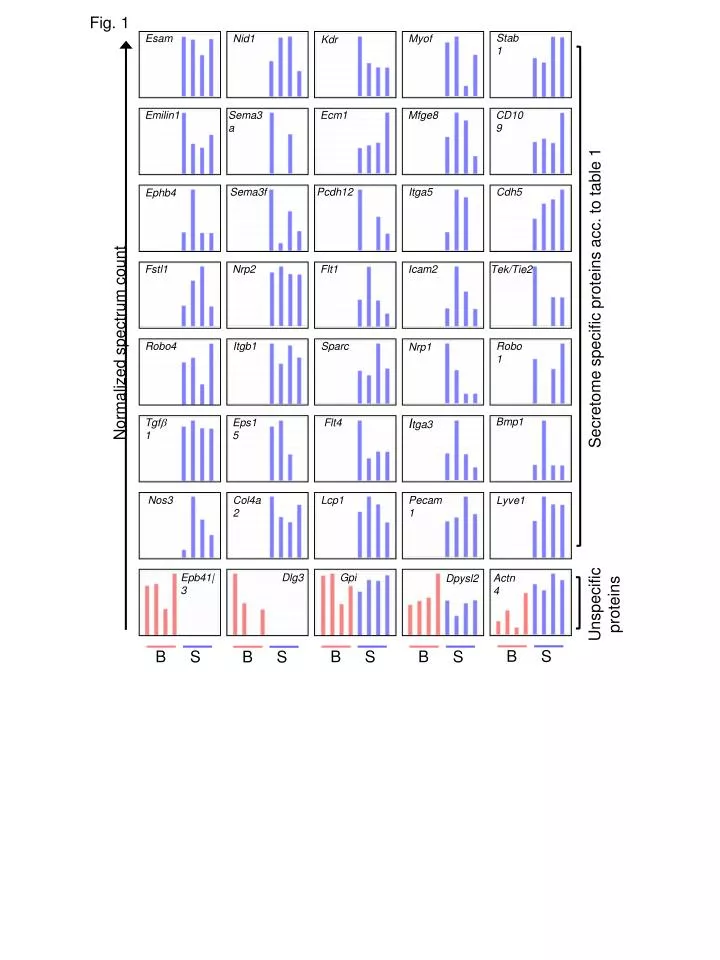
Fig. 1. Stab1. Esam. Nid1. Myof. Kdr. Emilin1. Sema3a. Ecm1. Mfge8. CD109. Secretome specific proteins acc . to table 1. Normalized spectrum count. Sema3f. Pcdh12. Itga5. Cdh5. Ephb4. Fstl1. Nrp2. Flt1. Icam2. Tek/Tie2. Robo4. Itgb1. Sparc. Robo1. Nrp1. I tga3. Bmp1.

kerry
Télécharger la présentation

Normalized spectrum count

An Image/Link below is provided (as is) to download presentation Download Policy: Content on the Website is provided to you AS IS for your information and personal use and may not be sold / licensed / shared on other websites without getting consent from its author. Content is provided to you AS IS for your information and personal use only. Download presentation by click this link. While downloading, if for some reason you are not able to download a presentation, the publisher may have deleted the file from their server. During download, if you can't get a presentation, the file might be deleted by the publisher.

E N D

Presentation Transcript


  1. Fig. 1 Stab1 Esam Nid1 Myof Kdr Emilin1 Sema3a Ecm1 Mfge8 CD109 Secretomespecificproteinsacc. totable 1 Normalizedspectrumcount Sema3f Pcdh12 Itga5 Cdh5 Ephb4 Fstl1 Nrp2 Flt1 Icam2 Tek/Tie2 Robo4 Itgb1 Sparc Robo1 Nrp1 Itga3 Bmp1 Tgf1 Eps15 Flt4 Nos3 Col4a2 Lcp1 Pecam1 Lyve1 Unspecificproteins Epb41|3 Dlg3 Gpi Actn4 Dpysl2 B S B S B S B S B S

More Related