Download
1 / 1
10 likes | 324 Vues
Control. P 3 CSK 4. P 3 CSK 4 + lapachol. Spot Volume. Spot 32. P. P+L. C. Spot Volume. Spot 274. Spot 327. Spot Volume. P. P. P. P. P+L. P+L. P+L. P+L. C. C. C. C. Spot 1391. Spot Volume. Spot Volume. Spot 1860. spot 32 : Grp78 (BIP)

E N D
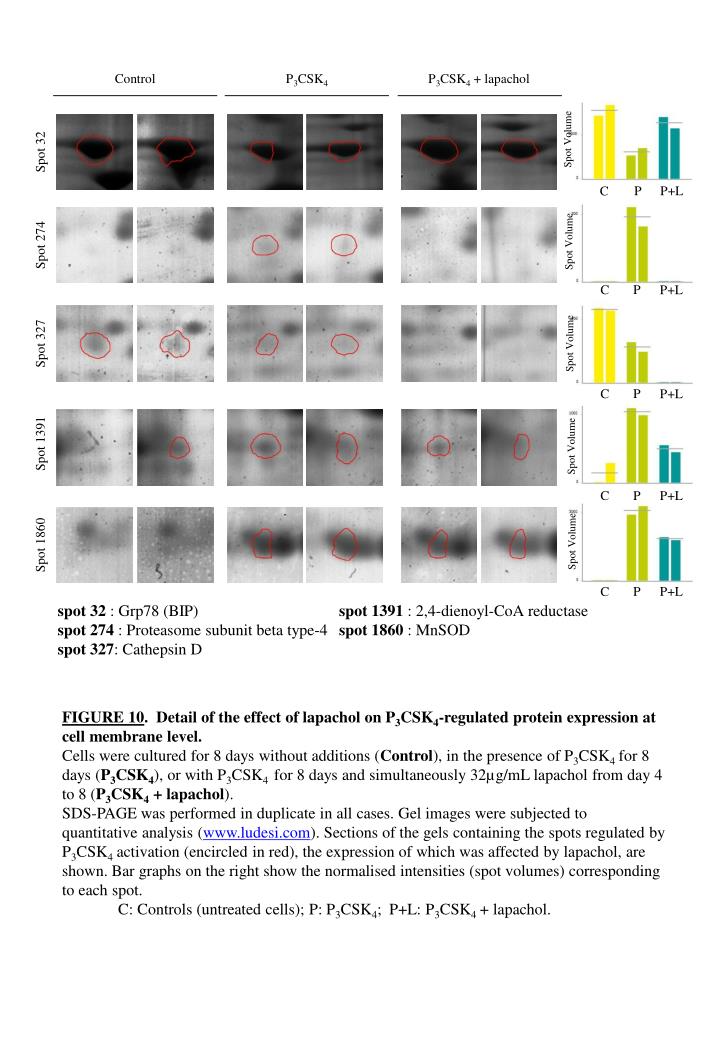
Control P3CSK4 P3CSK4 + lapachol Spot Volume Spot 32 P P+L C Spot Volume Spot 274 Spot 327 Spot Volume P P P P P+L P+L P+L P+L C C C C Spot 1391 Spot Volume Spot Volume Spot 1860 spot 32 : Grp78 (BIP) spot 274 : Proteasome subunit beta type-4 spot 327: Cathepsin D spot 1391 : 2,4-dienoyl-CoA reductase spot 1860 : MnSOD FIGURE 10. Detail of the effect of lapachol on P3CSK4-regulated protein expression at cell membrane level. Cells were cultured for 8 days without additions (Control), in the presence of P3CSK4 for 8 days (P3CSK4), or with P3CSK4for 8 days and simultaneously 32µg/mL lapachol from day 4 to 8 (P3CSK4+ lapachol). SDS-PAGE was performed in duplicate in all cases. Gel images were subjected to quantitative analysis (www.ludesi.com). Sections of the gels containing the spots regulated by P3CSK4 activation (encircled in red), the expression of which was affected by lapachol, are shown. Bar graphs on the right show the normalised intensities (spot volumes) corresponding to each spot. C: Controls (untreated cells); P: P3CSK4; P+L: P3CSK4+ lapachol.