Download
1 / 36
360 likes | 459 Vues
Agenda item: 17 Paper no: CM/03/12/14B. Staff Survey 2012 - Executive Team Presentation (Annex B). Prepared by: GfK NOP. September, 2012. Research Approach. Predominantly online survey with some paper surveys made available to those out of the organisation eg . long-term sick leave

E N D
Agenda item: 17 Paper no: CM/03/12/14B Staff Survey 2012 - Executive Team Presentation (Annex B) Prepared by: GfK NOP September, 2012
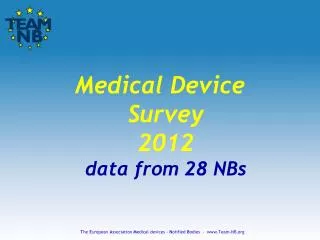
Research Approach • Predominantly online survey with some paper surveys made available to those out of the organisation eg. long-term sick leave • Survey live: 13th June - 4th July 2012 • All employees given opportunity to participate including temporary staff: 1,983 in total • 1578 completed responses: 80% response rate (76% in 2010)
Response Rates Overall a very high response rate (80%) was achieved for the survey (76% in 2010) ensuring the results are a good representation of overall attitudes within the organisation 1578 completed surveys includes 19 respondents who chose not to reveal their job function
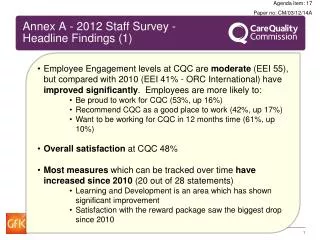
Headline Findings (1) • Employee Engagement levels at CQC are moderate (EEI 55), but compared with 2010 (EEI 41% - ORC International) have improved significantly. Employees are more likely to: • Be proud to work for CQC (53%, up 16%) • Recommend CQC as a good place to work (42%, up 17%) • Want to be working for CQC in 12 months time (61%, up 10%) • Overall satisfaction at CQC 48% • Most measures which can be tracked over time have increased since 2010 (20 out of 28 statements) • Learning and Development is an area which has shown significant improvement • Satisfaction with the reward package saw the biggest drop since 2010
Headline Findings (2) • Employees are most positive about the team in which they work and the ethos of service focus within the organisation • The lowest performing areas are morale, management of change and communications across the organisation • The directorates with the highest engagement levels are: • Human Resources (EEI 71) • Strategic Marketing & Comms (EEI 62) • The directorate with the lowest engagement level is: • Intelligence (EEI 52)
Overview Guide to understanding trends since 2010 Increase since 2010 Decrease since 2010 6
Top Performing areas Employees are most positive about the team in which they work and the ethos on service focus % strongly agree/agree
Lowest Performing areas Employees are least positive about morale and communications across the organisation as well as the management of change % strongly agree/agree
Biggest Increases since 2010 I believe I have the opportunity for personal development and growth in CQC (49%) I believe CQC employees display the employee values (66%) I know how to access learning and development opportunities in CQC (72%) +23% +22% +44% • I am clear about what I am expected to achieve in my role (76%) • I feel I am kept informed about matters affecting me in a timely manner (47%) • I would recommend CQC as a good place to work (42%) • I feel communications across different parts of CQC are effective (24%) • I believe that CQC makes a positive difference to people's lives (73%) • I feel proud to work for CQC (53%) • I believe that the work CQC does with service providers improves standards of care (77%) +15 to + 17%
Other Increases since 2010 • My Line Manager motivates me to do my role well (63%) • I believe that CQC has a strong commitment to equality and diversity in its regulatory functions (71%) • I believe action will be taken on the results of this survey (33%) • I would like to be working for CQC in 12 months' time (61%) +10 to + 14% • The reasons behind organisational changes are clearly communicated (31%) • My Line Manager is open to my ideas and suggestions (72%) • I believe the behaviours of leaders are consistent with the values of CQC (33%) • I am treated with fairness and respect in CQC (58%) • I believe that CQC is an equal opportunities employer (68%) +6 to +9%
Decreases since 2010 -17% • I am satisfied with my overall reward package (41%) - 8% • Considering the role I perform, I am suitably rewarded in CQC (36%) - 6% • I am able to strike the right balance between my work and home life (51%) • In my team, I can rely on support from my colleagues when I need it (88%) • Compared with other people doing a similar role in other organisations, I think I am rewarded fairly (34%) • I have a clear understanding of my contribution to achieving the objectives of CQC (70%) - 3 to 4%
Benchmark data GfK Public Sector EEI Benchmark: 56 *BM = GfK’s benchmark measure for public sector organisations
Drivers of Employee Engagement CQC Employee EngagementIndex = 55 Performance is the average of the results across questions falling into each theme
Employee Engagement Index by Directorate CQC Employee EngagementIndex Overall 2012: 55 CQC Employee EngagementOverall 2010: 41% * * Calculation based on ORC International approach
Understanding Employee Engagement HighPerformance Maintain Strength High Importance & Strong Performance: Continue efforts Secondary Importance & Strong Performance: Maintain: lower priority Performance Secondary Action Immediate Action Secondary Importance & Low Performance: Action still required High Importance & Low Performance: Essential to improve LowPerformance Least Important Most Important Importance
Drivers of Employee Engagement vs. Performance HighPerformance Maintain Best Performers Performance LowPerformance Secondary Action Priority Action Area Least Important Most Important Importance
Results in Detail Guide to understanding trends since 2010 Increase since 2010 Decrease since 2010 18
Areas requiring immediate action: Vision and Employee Values Overall Perceptions 19
Vision and Employee Values Although many believe employees display the values of CQC (and significantly more than in 2010), they are less positive that leaders display the same values
Overall Perceptions Although employees are generally committed to the future of CQC and the effect it has on people’s lives, the issue of morale in the organisation needs to be addressed urgently
Areas requiring secondary action: Managing Change Reward Communication Survey Action Planning 22
Managing Change Nearly three-fifths of employees do not believe that changes are effectively implemented at CQC
Reward Opinions were divided as to how employees viewed their reward package at CQC, but around two-fifths of employees were dissatisfied with their reward and opinions had become more negative since 2010 *BM = GfK’s benchmark measure for public sector organisations
Communication Opinions on Communications have improved significantly since 2010, but there is a clear need to continue to focus efforts on how cross-team communications can be improved across the organisation
Survey action planning Although a third of employees believe action will be taken as a result of the survey and improvements have been made since the last survey, a similar proportion disagreed with these statements *BM = GfKs benchmark measure for public sector organisations
Areas to be maintained: Learning and Development Leadership Teamwork 27
Learning and Development I It is clear that Learning & Development initiatives have impacted strongly with a huge increase in the proportion of staff being aware of how to access opportunities
Leadership (1) Opinions on Line Managers are generally very positive
Leadership (2) Employees were least positive about leaders in terms of their decision-making and visibility *BM = GfK’s benchmark measure for public sector organisations
Teamwork Overall, opinions about the team in which employees work are very positive, but teamwork across teams in CQC is less well perceived *BM = GfK’s benchmark measure for public sector organisations
Areas of strength to maintain and promote: My Role Equality & Diversity, Inclusion and Well-being Service Focus 32
My Role Employees generally have clear expectations and understanding of their role, but are less likely to feel part of CQC’s future
Equality & Diversity, Inclusion and Well-being Employees are generally positive that CQC is committed to equality and diversity, but striking the balance between home and work is hard for some
Bullying, Harassment and Discrimination Nearly two-fifths of employees (37%) claimed to have either witnessed or actually been bullied or harassed at work
Service Focus I There is clearly a strong service ethos amongst staff at CQC, but they do not always feel the organisation supports them in terms of delivering this service *BM = GfK’s benchmark measure for public sector organisations