Download
1 / 50
500 likes | 681 Vues
Epidemiology II. ENVR 890-Sec. 003/ENVR 296-Sec. 003 Mark D. Sobsey With material from Prof. Jack Colford, UC-Berkeley Dr. Steve Luby, ICDDR,B Joseph Eisenberh, U. of Michigan. Using Epidemiology for Microbial Risk Analysis. Problem Formulation what’s the problem?

E N D
Epidemiology II ENVR 890-Sec. 003/ENVR 296-Sec. 003 Mark D. Sobsey With material from Prof. Jack Colford, UC-Berkeley Dr. Steve Luby, ICDDR,B Joseph Eisenberh, U. of Michigan
Using Epidemiology for Microbial Risk Analysis Problem Formulation • what’s the problem? • determine what infectious disease is posing a risk • its clinical features • causative agent • routes of exposure/infection • health effects (This is sort of like a preliminary QMRA, especially for exposure and health effects analyses)
Using Epidemiology for Microbial Risk Analysis Exposure Assessment • how • how much • when • where and why exposure occurs • vehicles • vectors • doses • loads
Using Epidemiology for Microbial Risk Analysis Health Effects Assessment • Human clinical trials for dose-response • field studies of endemic and epidemic disease in populations
Using Epidemiology for Microbial Risk Analysis Risk Characterization Epidemiologic measurements and analyses of risk: • relative risk • risk ratios • odds ratios • regression models of disease risk • dynamic models of population disease risk • Other disease burden characterizations: • relative contribution to overall disease burdens • effects of prevention and control measures and interventions • economic considerations (monetary cost of the disease, cost effectiveness of prevention and control measures)
Elements That May Be Considered in Risk Characterization • Evaluate health consequences of exposure scenario • Risk description (event) • Risk estimation (magnitude, probability) • Characterize uncertainty/variability/confidence in estimates • Conduct sensitivity analysis • evaluate most important variables and information needs • Address items in problem formulation (reality check) • Evaluate various control measures and their effects on risk magnitude and profile • Conduct decision analysis • evaluate alternative risk management strategies
Types of Epidemiological Studies that Have Been Used in Risk Assessment for Waterborne Disease
Some More Epidemiological Terms and Concepts • Outbreaks: two or more cases of disease associated with a specific agent, source, exposure and time period • Epidemic Curve (Epi-curve): Number of cases or other measure of the amount of illness in a population over time during an epidemic • Describes nature and time course of outbreak • Can estimate incubation time if exposure time is known • Can give clues to modes of transmission: point source, common source, and secondary transmission
Some More Epidemiological Terms and Concepts: Epidemic Curves # cases # cases Time Time Common Source Point Source
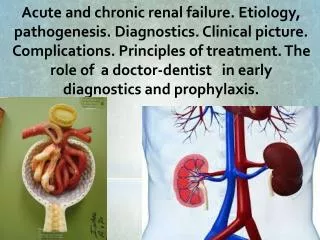
Additional Analyses of Health Effects:Health Effects Assessments • Health Outcomes of Microbial Infection • Identification and diagnosis of disease caused by the microbe • disease (symptom complex and signs) • Acute and chronic disease outcomes • mortality • diagnostic tests • DALYs • Sensitive populations and effects on them • Disease Databases and Epidemiological Data
Databases for Quantification and Statistical Assessment of Disease - USA • National Notifiable Disease Surveillance System • National Ambulatory Medical Care Survey • International Classification of Disease (ICD) Codes • Other Databases • Special surveys • Sentinel surveillance efforts • Resources for disease surveillance vary greatly by country. • WHO and other international health entities assist countries lacking capacity for disease surveillance to obtain such data in various ways • Tracking is poor for some diseases, such as gastroenteritis and its specific causative agents (etiologies)
Methods to Diagnose Infectious Disease • Symptoms (subjective: headache, pain) and Signs (objective: fever, rash, diarrhea) • Clinical diagnosis: lab tests • Detect causative organism in clinical specimens • Detect other specific factors associated with infection • Immune response • Detect and assay antibodies • Detect and assay other specific immune responses
Health Outcomes of Microbial Infection • Acute Outcomes • Diarrhea, vomiting, rash, fever, etc. • Chronic Outcomes • Paralysis, hemorrhagic uremia (HUS), reactive arthritis, Guillain-Barre Syndrome, etc. • Hospitalizations • Deaths
Outcomes of Infection Process to be Quantified Exposure Infection Asymptomatic Infection Advanced Illness, Chronic Infections and Sequelae Disease Acute Symptomatic Illness: Severity and Debilitation Sensitive Populations Mortality Hospitalization
Acute and Chronic Outcomes Associated with Microbial Infections
Sensitive Populations • Infants and young children • Elderly • Immunocompromised • Persons with AIDs • Cancer patients • Transplant patients • Pregnant • Malnourished
Mortality Ratios for Enteric Pathogens in Nursing Homes Versus General Population
Impact of Waterborne Outbreaks of Cryptosporidiosis on AIDS Patients
Mortality Ratios Among Specific Immunocompromised Patient Groups with Adenovirus Infection
Predicted Waterborne Cryptosporidiosis in NYC in AIDS Patients Compared to the General Population Perz et al., 1998, Am. J. Epid., 147(3):289-301
Assessing Risk from Environmental Exposure to Waterborne Pathogens: Use of Dynamic, Population-Based Analytical Methods and Models The following material is based on a lecture prepared by Prof. Joe Eisenberg, formerly of the University of California-Berkeley and now at the University of Michigan Used with his permission
Overview • Role of water in disease burden • Water as a route of disease transmission • Methods of risk estimation • Direct: intervention trials • Indirect: risk assessment • Population-level risks • Example: the Milwaukee outbreak
Importance of Waterborne Pathogens Domestic: U.S. interest in water quality • 1993 Cryptosporidium outbreak • Increasing number of disease outbreaks associated with water • Congressional mandates for water quality • (Safe Drinking Water Act) • Emphasis on risk assessment and regulation
Pathways of Transmission • Person-person • Mediated through fomites (e.g., phone, sink, etc.) • Often associated with hygiene practices • Person-environment-person • Mediated through water, food, or soil • Contamination can occur through improper sanitation (example: sewage inflow into drinking water source or lack of latrines) • Animals are often sources (Zoonotic pathogens) • Exposure can occur through improper treatment of food or water
The Disease Transmission Process Risk estimation depends on transmission dynamics and exposure pathways Transport to other water sources Agricultural Runoff Drinking Water Recreational Waters or Wastewater reuse Animals 2° Trans. Food
Approaches to Risk Estimation • Direct approach: The intervention trial • Can be used to assess risk from drinking water and recreational water exposures • Problems with sensitivity (sample size issue) • Trials are expensive • less so in developing world settings • Indirect approach: Mathematical models • Must account for properties of infectious disease processes • Pathogen specific models • Uncertainty and variability may make interpretation difficult.
Approaches to Risk Estimation • Combining direct and indirect approaches • Models can define the issues and help design studies. • Epidemiology can confirm current model structure and provide insight into how to improve the model
Approaches for Risk Estimation: Direct estimates of waterborne infectious illnesses • Surveillance: count waterborne infectious illnesses • How can a waterborne disease outbreak be distinguished from other outbreak causes (food, fomites, etc.)? • What about endemic disease? • Observational • Ecologic studies (e.g., sero-survey comparing communities with and without filtration) • Time series (e.g., correlation between turbidity and hospitalization data)
Approaches for Risk Estimation:Distinguishing waterborne GI disease from other GI diseases • Methods for addressing the question • In a single community: a randomized, blinded, placebo-controlled trial • design provides an estimate of the effectiveness of a drinking water intervention. • Basic study design: two groups • “Exposed” group = normal tap water. • “Treated” group = use a water treatment device to provide water as pathogen-free as technically possible
Approaches for Risk Estimation: A Tap Water Intervention Trial • Enroll 1000 subjects • 500 receive an active home water treatment device (and carry drinking water to work, etc. when practical) • 500 receive a “placebo” home water drinking device (does nothing to change the water) • Follow the subjects for one year with daily logs of GI illness • Alternative design: Each household changes device type after 6 months.
Approaches for Risk Estimation: A Tap Water Intervention Trial • Placebo (control) group (tap water): • 90 illnesses over course of the study • “Rate” = 90 / 500 Rate in placebo group = 0.18 per person per year • Treated (intervention) group (active device): • 60 illnesses in the treated group (active device) • “Rate” = 60 / 500 Rate in treated group = 0.12 per person per year
Approaches for Risk Estimation: Epidemiologic Measures • Relative Risk (RR) Incidence in exposed group Incidence in unexposed group • Interpretation: the risk of disease in the tap water group is 1.5 times higher than that of the treated group
Approaches for Risk Estimation: Epidemiologic Measures • Attributable Risk (AR) Incidence in exposed – Incidence in unexposed Interpretation: There are 6 excess cases of disease per 100 subjects receiving tap water
Approaches for Risk Estimation: Epidemiologic Measures • Attributable Risk Percent (AR%) Excess cases in exposed Incidence in exposed Interpretation: 33% of the cases of disease in the tap water group are due to water
Approaches for Risk Estimation: Epidemiologic Measures • To generalize beyond the cohort, need an estimate of the community incidence. • PAR: population attributable risk • PAR%: population attributable risk % • AR compares completely protected group with completely unprotected group. • PAR incorporates intermediate exposure
Approaches for Risk Estimation: Epidemiologic Measures • Population attributable risk • Incidence in the community–incidence in the unexposed Interpretation: In the community, 2 excess cases of disease per every 100 subjects in the community
Approaches for Risk Estimation: Epidemiologic Measures • Population attributable risk percentage Excess cases in the community Incidence in the exposed Interpretation: 14% of the cases of disease in the community are due to tap water
Approaches for Risk Estimation: Tap Water Intervention Trials: Developed World Trials in immunocompetent populations • Canada (Payment)--challenged surface water • AR = 0.35 (Study 1), 0.14-0.4 (Study 2) • Australia (Fairley)--pristine surface water • No effect • Walnut Creek (UCB) – pilot trial • AR = 0.24 (non-significant effect) • Iowa (UCB)--challenged surface water • No effect Trials in sensitive populations • HIV+ in San Francisco (UCB)--mixed sources • Elderly in Sonoma (UCB)--intermediate quality surface
Approaches for Risk Estimation: Tap Water Intervention Trials • Davenport, Iowa study • Comparing sham vs. active groups • AR = - 365 cases/10,000/year (CI: -2555, 1825) • Interpretation: No evidence of a significantly elevated drinking water risk • Is the drinking water safe?
Approaches for Risk Estimation: Risk Assessment vs. Intervention Trial Comparing estimates from a risk assessment to randomized trial results (Eienberg et al. AJE, submitted) • Data collected during the intervention trial • Self-report illnesses from participants: Weekly diaries • Source water quality: Cryptosporidium, Giardia, enteric viruses • Drinking water patterns: RDD survey • Water treatment: B. subtilis, somatic coliphage
Approaches for Risk Estimation: Risk Assessment Results Overall risk estimate: 14 cases/10,000/yr
Approaches for Risk Estimation: Comparison/Conclusions Table 3. Comparison of risk assessment and intervention trials
Conclusions Risk assessments should use models that can integrate relevant information • Health data • Epidemiology • Basic biology • Environmental data • Water quality • Fate and transport • Need a population perspective • Model-based approach