Download
1 / 56
560 likes | 652 Vues
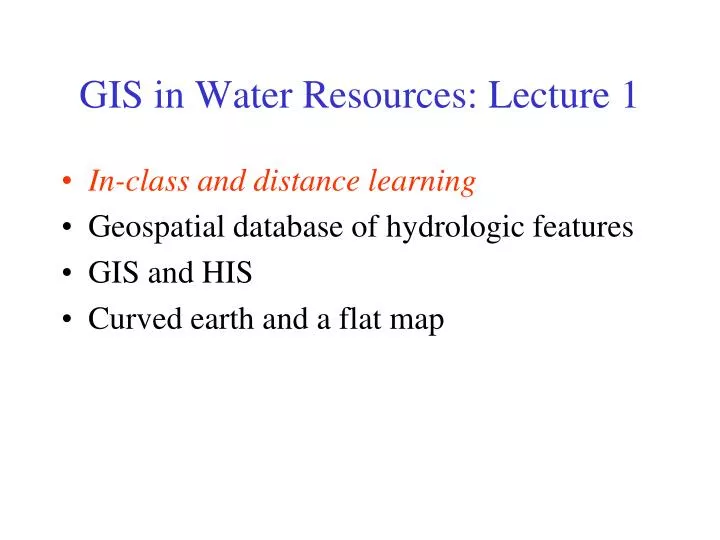
GIS in Water Resources: Lecture 1. In-class and distance learning Geospatial database of hydrologic features GIS and HIS Curved earth and a flat map. Lectures Powerpoint slides Video streaming Readings Handouts and lecture synopses Homework Computer exercises Hand exercises.

E N D
GIS in Water Resources: Lecture 1 • In-class and distance learning • Geospatial database of hydrologic features • GIS and HIS • Curved earth and a flat map
Lectures Powerpoint slides Video streaming Readings Handouts and lecture synopses Homework Computer exercises Hand exercises Term Project Oral presentation HTML report Class Interaction Email Discussion Examinations Midterm, final Six Basic Course Elements
Dr David Tarboton Students at Utah State University Dr Ayse Irmak Students at University of Nebraska - Lincoln Our Classroom Dr David Maidment Students at University of Texas at Austin
David R. Maidment B.E. in Agricultural Engineering (with First Class Honors) from University of Canterbury, Christchurch, New Zealand, 1972 MS, PhD in Civil Engineering from University of Illinois, 1974 and 1976, respectively 1981 – joined University of Texas at Austin as an Assistant Professor, and have been on the faculty ever since. Now Hussein M. AlHarthy Centennial Chair in Civil Engineering Initiated the GIS in Water Resources course in 1991 – this is the 20th anniversary! Worked with ESRI since 1994 on a GIS Hydro Preconference seminar for the ESRI Users Conference Leader of the CUAHSI Hydrologic Information System project since 2004
David Tarboton • B.ScEng in Civil Engineering from the University of Natal, Durban, South Africa 1981 • M.S. and Sc.D from MIT, Cambridge, Massachusetts, 1987 and 1990 respectively, Thesis: “The Analysis of River Basins and Channel Networks Using Digital Elevation Models” • 1990 - Joined Faculty at Utah State University in Civil and Environmental Engineering • 1996 - Developed D-Infinity to have a better contributing area for study of landscape evolution – published 1997. • 1997 - Contract to develop user friendly slope-stability tool based on D-infinity contributing area. Led to SINMAP developed for ArcView 3, the first GIS software I used. • Gradually adapted the set of Fortran and C codes that had accumulated terrain analysis research to be distributable as TARDEM/TauDEM • Participated in GISWR since 1999 (this year is the 12th time – I skipped 2007 while working on WATERS Network conceptual design)
Ayse Irmak M.E. (1998) & Ph.D (2002). Agricultural and Biological Engineering. University of Florida. Gainesville, FL. Dissertation: “Linking multiple layers of information to explain soybean yield variability” . 5 papers Linking multi-variables for diagnosing causes of spatial yield variability Analysis of spatial yield variability using a combined crop model-empirical approach Estimating spatially variable soil properties for crop model use Relationship between plant available soil water and yield Artificial neural network as a data analysis tool in precision farming 2004- Joined to UNL and continued to work on computer simulation of crop production for another year and gradually moved to Remote Sensing field with applications in Natural Resources Systems. 2006 - Remote Sensing-based Estimation of Evapotranspiration and other Surface Energy Fluxes 2008- Working on development of the Nebraska Hydrologic Information System (HIS), which is designed to provide improved access to evapotranspiration and other hydrologic data for end users. Participated in GISWR since 2006 (this year is the 5th time – I skipped 2007 due to position change at UNL)
Traditional Classroom Community Inside and Outside The Classroom University Without Walls
Instructor-Centered Presentation Community-Centered Presentation Learning Styles Instructor Student We learn from the instructors and each other
GIS in Water Resources: Lecture 1 • In-class and distance learning • Geospatial database of hydrologic features • GIS and HIS • Curved earth and a flat map
Geographic Data Model • Conceptual Model – a set of concepts that describe a subject and allow reasoning about it • Mathematical Model – a conceptual model expressed in symbols and equations • Data Model – a conceptual model expressed in a data structure (e.g. ascii files, Excel tables, …..) • Geographic Data Model – a conceptual model for describing and reasoning about the world expressed in a GIS database
Spatial Data: Vector format Vector data are defined spatially: (x1,y1) Point - a pair of x and y coordinates vertex Line - a sequence of points Node Polygon - a closed set of lines
Themes or Data Layers Vector data: point, line or polygon features
Kissimmee watershed, Florida Themes
Raster and Vector Data Raster data are described by a cell grid, one value per cell Vector Raster Point Line Zone of cells Polygon
Santa Barbara, California http://srtm.usgs.gov/srtmimagegallery/index.html
The challenge of increasing Digital Elevation Model (DEM) resolution (Dr Tarboton’s research) 1980’s DMA 90 m 102 cells/km2 1990’s USGS DEM 30 m 103 cells/km2 2000’s NED 10-30 m 104 cells/km2 2010’s LIDAR ~1 m 106 cells/km2
How do we combine these data? Digital Elevation Models Streams Watersheds Waterbodies
Remote Sensing Coverage of Nebraska P33R30 10 P32R30 9 P31R30 10 P30R30 9 P29R30 10 P33R31 11 P32R31 10 P31R31 12 P30R31 9 P29R31 11 P28R31 8 P29R32 12 P28R32 10 P27R32 8 P33R32 15 P32R32 8 P31R32 12 P30R32 10
Data intensive science synthesizes large quantities of information (Hey et al., 2009). • exploiting advanced computational capability for the analysis and integration of large new datasets to elucidate complex and emergent behavior • In hydrology, the image at left (Ralph et al., 2006) illustrates connection between extreme floods recorded in USGS stream gages and atmospheric water vapor from space based sensors • Satellite remote sensing and massive datasets enhance understanding of multi-scale complexity in processes such as rainfall and river networks
GIS in Water Resources: Lecture 1 • In-class and distance learning • Geospatial database of hydrologic features • GIS and HIS • Curved earth and a flat map
Linking Geographic Information Systems and Water Resources Water Resources GIS
A Key Challenge How to connect water environment with water observations Time Series Data GIS Water Environment (Watersheds, streams,gages, sampling points) Water Observations (Flow, water levelconcentration)
http://www.cuahsi.org • CUAHSI is a consortium representing 125 US universities • Supported by the National Science Foundation Earth Science Division • Advances hydrologic science in nation’s universities • Includes a Hydrologic Information System project
How the web works Catalog(Google) Catalog harvest Search Web Server (CNN.com) Browser (Firefox) Access HTML – web language for text and pictures
We Collect Lots of Water Data Water quantity Rainfall Soil water Water quality Meteorology Groundwater
The Data have a Common Structure A point location in space A series of values in time Gaging – regular time series Sampling – irregular time series
Services-Oriented Architecture for Water Data Catalog Service registration Search Catalog harvest Server User Data access WaterML – web language for water data
What is a “services-oriented architecture”?Networks of computers connected through the web ……. • Everything is a service • Data, models, visualization, …… • A service receives requests and provides responses using web standards (WSDL) • It uses customized web languages • HTML (HyperText Markup Language) for text and pictures • WaterML for water time series (CUAHSI/OGC) • GML for geospatial coverages (OGC) ….. supporting a wide range of users
WaterML as a Web Languagefor Colorado River at Austin I accessed this WaterML service from USGS at 11:22AM http://waterservices.usgs.gov/nwis/iv?sites=08158000&period=P7D¶meterCd=00060 and got back these flow data from USGS which are up to 10:45AM USGS has real-time WaterML services for about 22,000 sites available 24/7/365 http://waterservices.usgs.gov/nwis/iv?sites=08158000&period=P7D¶meterCd=00060
CUAHSI Water Data Services Catalog All the data comes out in WaterML 69 public services 18,000 variables 1.9 million sites 23 million series 5.1 billion data values And growing The largest water datacatalog in the world maintained at the San Diego Supercomputer Center
The CUAHSI Hydrologic Information System (HIS) is an internet based system to support the sharing of hydrologic data. It is comprised of hydrologic databases and servers connected through web services as well as software for data publication, discovery and access. CUAHSI HIS HydroServer – Data Publication HydroCatalog Data Discovery Lake Powell Inflow and Storage HydroDesktop – Combining multiple data sources HydroDesktop – Data Access and Analysis
Organize Water Data Into “Themes” Integrating Water Data Services From Multiple Agencies . . . Across Groups of Organizations
Bringing Water Into GISThematic Maps of Water Observations as GIS Layers Groundwater Streamflow Salinity Unified access to water data in Texas ….
Geospatial Data Services ArcGIS Online Service registration Search Catalog harvest ArcGIS Server ArcGIS Desktop Data access Map services – web language for geospatial data
ArcGIS Online GIS on the web – online map services http://www.arcgis.com
Topographic Base Map in ArcGIS Online World United States Texas Austin Home
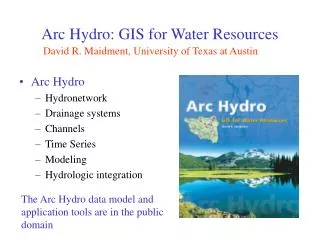
Arc Hydro: GIS for Water Resources Published in 2002 • ArcHydro • An ArcGIS datamodelfor water resources • Arc Hydro toolset for implementation • Framework for linking hydrologicsimulationmodels The most comprehensive terrain analysis and watershed toolset available Work of Dean Djokic and his team at ESRI Water Resources Applications
Arc Hydro Groundwater: GIS For Hydrogeology • Describes the data model – public domain • Toolset and data model available now from Aquaveo • Book from ESRI Press, published in Spring 2011 • Adapted for a National Groundwater Information System for Australia
Analysis, Modeling, Decision Making Arc Hydro Geodatabase Hydrologic Information System A synthesis of geospatial and temporal data supporting hydrologic analysis and modeling
GIS in Water Resources: Lecture 1 • In-class and distance learning • Geospatial database of hydrologic features • GIS and HIS • Curved earth and a flat map
Origin of Geographic Coordinates Equator (0,0) Prime Meridian
Latitude and Longitude Longitude line (Meridian) N W E S Range: 180ºW - 0º - 180ºE Latitude line (Parallel) N W E S (0ºN, 0ºE) Equator, Prime Meridian Range: 90ºS - 0º - 90ºN
60 N 30 N 60 W 120 W 90 W 0 N Latitude and Longitude in North America 40 50 59 96 45 0 Austin: Logan: Lincoln: (30°18' 22" N, 97°45' 3" W) (41°44' 24" N, 111°50' 9" W) (40°50' 59" N, 96°45' 0" W)