Download

1 / 20
200 likes | 368 Vues
Kemal Sarica Wallace E. Tyner Purdue University July 28-31, 2013 ANCHORAGE 32 nd USAEE/IAEE North American Conference. Economic and Environmental Impacts of Increased U.S. Natural Gas Exports. THE G LOBAL P OLICY R ESEARCH I NSTITUTE. Shale Gas Benefits.

E N D
Kemal Sarica Wallace E. Tyner Purdue University July 28-31, 2013 ANCHORAGE 32nd USAEE/IAEE North American Conference Economic and Environmental Impacts of Increased U.S. Natural Gas Exports THE GLOBAL POLICY RESEARCH INSTITUTE
Shale Gas Benefits Shale gas is a game changer. It is part of the reason behind the manufacturing resurgence in the U.S. It will stimulate much more conversion of old coal fired electric power plants in the U. S. to natural gas, thereby providing environmental benefits. The IEA estimates that shale gas done right is only 7% more expensive than business as usual, so it can be done with minimal adverse environmental impact.
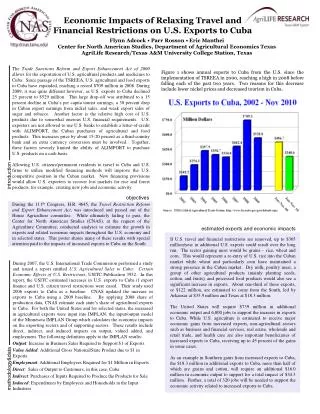
Impacts of Increased Natural Gas Exports Free trade is beneficial in almost all cases from a global perspective. However, that does not mean that partial trade liberalization in all cases is good for every country. In fact, there are many examples of countries or regions losing from partial trade liberalization. The question, then, is what are the impacts on the U.S. economy and environment of permitting increased natural gas exports.
Impacts of Increased Natural Gas Exports We use a model called MARKAL-Macro to evaluate the impacts of increased natural gas exports. • MARKAL is a bottom-up energy model that solves for the lowest cost mix of meeting energy service demands over the specified time horizon. • MARKAL-Macro adds a macroeconomic sector to provide two way feedback on energy service costs and demands.
Model and Modifications MARKAL Macro based on the EPA 2010 single region MARKAL database with DOE AEO 2010 assumptions. We have made many modifications to the base data, but the most important for this study is to use the MIT natural gas supply curves: • We replaced the default data base curves with the MIT high availability natural gas resource supply curves based on the MIT Energy Initiative report (The MIT Energy Initiative, 2011).
Model and Modifications Characterization of Natural Gas Supply Curves Natural gas resource supply curves represent a relationship, between price and quantity with no time dimension. How fast can supply adjust over time? We used two parameter sets regarding exponential growth and decay rates for each natural gas supply step to define two reference cases: • Standard reference scenario, 5% annual growth with 3% annual production decay rate (the default values) • Elastic reference scenario, 10% annual growth and no decay rate limit (calibrated to replication EIA data).
Export Policy Scenarios We conducted our analysis for three cases, export increases of: 6 BCF/day, 12 BCF/day, and 18 BCF/day. We assessed impacts on • GDP, natural gas prices and production, primary energy resource mix, electricity and transportation sectors, and energy intensive manufacturing
ResultsReference Case Comparison GDP is always higher with the elastic reference case. Electricity prices, are 10 % lower, with the elastic case, due to higher use of natural gas and lower natural gas prices compared to standard reference case. Total primary energy consumption increases with the elastic reference case mainly due to lower energy cost. Coal use decreases more under the elastic case due to fuel switching with natural gas, up to 18% lower in the short run. Natural gas use as transportation fuel increases significantly under the elastic case, up to 100%, compared to standard case.
ResultsExport Impacts - GDP The average decline is about $7 billion.
Conclusions Permitting significant natural gas exports causes a small reduction in US GDP. There is loss of labor and capital income in all energy intensive sectors, and electricity prices increase Higher natural gas prices cause pervasive losses throughout the commercial, industrial, and residential sectors The two reference cases essentially bracket the likely supply response, and the general trends of results are robust through both cases. These results suggest caution is in order in approving large levels of LNG exports.
Conclusions In the presence of a Clean Energy Standard • The GDP and sectoral impacts are similar, but the impacts on electricity and transport are substantially different. • The CES induces considerably higher natural gas prices because of the added demand for natural gas for power generation. • Natural gas exports on top of CES cause prices to go even higher.
Thanks! Questions and Comments