Download
1 / 14
140 likes | 227 Vues
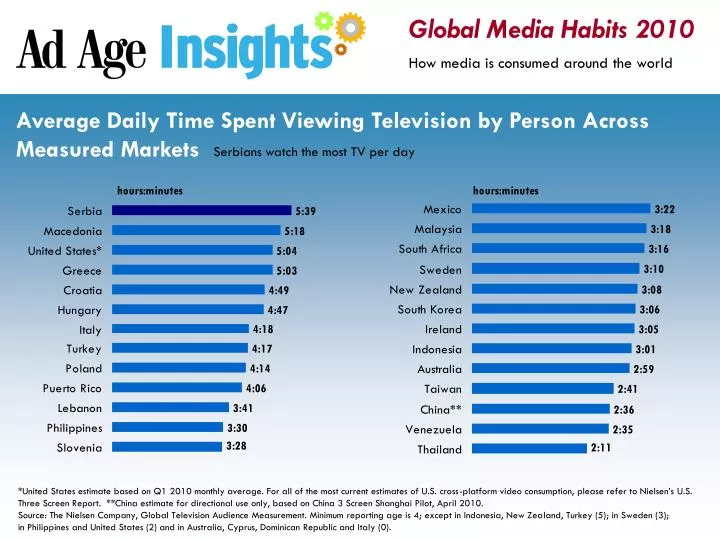
Global Media Habits 2010 How media is consumed around the world. Average Daily Time Spent Viewing Television by Person Across Measured Markets. Serbians watch the most TV per day.

E N D
Global Media Habits 2010 How media is consumed around the world Average Daily Time Spent Viewing Television by Person Across Measured Markets Serbians watch the most TV per day *United States estimate based on Q1 2010 monthly average. For all of the most current estimates of U.S. cross-platform video consumption, please refer to Nielsen’s U.S. Three Screen Report. **China estimate for directional use only, based on China 3 Screen Shanghai Pilot, April 2010. Source: The Nielsen Company, Global Television Audience Measurement. Minimum reporting age is 4; except in Indonesia, New Zealand, Turkey (5); in Sweden (3); in Philippines and United States (2) and in Australia, Cyprus, Dominican Republic and Italy (0).
Global Media Habits 2010 How media is consumed around the world Number of TVs Per Household in Selected Countries Spain, United Kingdom, USA, Chile, Columbia, Venezuela and Mexico have the greatest number of TVs Source: Global TGI network, coordinated byKantar
Global Media Habits 2010 How media is consumed around the world Index of HDTV Ownership by Region Index = 100. Both North America and Europe over-index for HDTV ownership Notes: n=27,665 online consumers, ages 15+; Indexed to all respondents, globally. Source: The Nielsen Co., Global Online Survey, March 2010
Global Media Habits 2010 How media is consumed around the world Total Number of Newspaper Titles (Paid and Free), 2005-2009 By region. 6,241newspaper titles in Asia, a region where the number of dailies is still growing Notes: This table includes figures from countries and territories for which WAN had at least one year of data on number of titles or circulation of paid or free dailies. *WAN estimated some figures for countries and territories that do not have a complete set of data for all five years. Source: World Association of Newspapers
Global Media Habits 2010 How media is consumed around the world Circulation of Dailies, 2005-2009 Total average circulation, in thousands -3.74% North American circulation is declining, but Europe’s rate of decline is greater Notes: This table includes figures from countries and territories for which WAN had at least one year of data on number of titles or circulation of paid or free dailies. *WAN estimated some figures for countries and territories that do not have a complete set of data for all five years. Source: World Association of Newspapers
Global Media Habits 2010 How media is consumed around the world Average Circulation Per Title, 2005-2009 By region, in thousands In Africa,daily newspapers are increasing their circulation Notes: This table includes figures from countries and territories for which WAN has information on both number of titles and circulation for both paid and free dailies. *WAN estimated some figures for countries and territories that do not have a complete set of data for all five years. Source: World Association of Newspapers
Global Media Habits 2010 How media is consumed around the world Annual change 20% 19% 19% 20% 29% 36% Total worldwide broadband penetration, 2005-2009 Approximate broadband subscribers, in millions 2010 At year’s end, broadband subscribers will number over 500M and account for 35% of all internet connections Source: Paul Budde Communication, 2010
Global Media Habits 2010 How media is consumed around the world 25% 23% 22% 15% 6.5% 5.5% 3% Total Number of Broadband Households by Region, 2009 Broadband subscriber households, in millions. Market share Western Europe has the highest percentage of broadband households globally Source: Paul Budde Communication, 2010
Global Media Habits 2010 How media is consumed around the world Q1 2009 Q1 2008 Top ten countries by number of broadband subscribers, 2008-2009 Subscribers, in millions 24% Increase in broadband subscribers in China, where the average user spends 2.7 hours a day online Note: Figures are rounded. Broadband is defined as a service with minimum speed of 144Kb/s. Figures are based on self reporting by carriers. Source: Paul Budde Communication, 2010
Global Media Habits 2010 How media is consumed around the world Mobile subscribers by region, 1993-2009 Subscribers, in millions 2.05B China, India and Indonesia are markets with high numbers of mobile users Notes: Statistics for Turkey are included in the Middle East. North America includes USA and Canada, but excludes Mexico, which is included in Latin America.
Global Media Habits 2010 How media is consumed around the world Worldwide Smartphone Sales by Operating System, 2008-2009 By units and market share (%) NOKIA A majority of smartphones still use its Symbian operating system Source: Gartner, Feb. 2010
Global Media Habits 2010 How media is consumed around the world NOTEBOOK NETBOOK TABLET DESKTOP Tablet sales forecast and computing mix U.S., 2008-2015 Share of U.S. consumer PC sales by form factor 23% Projected sales of tablets, expected to pass desktop PC sales Percentages not total 100% because of rounding. Note: As of Q3 2010, the data in this forecast is currently being updated. Source: Forrester
Global Media Habits 2010 How media is consumed around the world Mobile Phone Video Penetration by Region, 2010 Index = 100. Emerging markets over-index for mobile video Notes: n=27,665 online consumers, ages 15+; Indexed to all respondents, globally. Source: The Nielsen Co., Global Online Survey, March 2010
Global Media Habits 2010 How media is consumed around the world Global Internet Traffic Growth Forecast, 2009-2014 Consumer internet traffic, petabytes per month Asia Will be responsible for the biggest slice of internet traffic by 2014 Video Internet traffic will increase mainly as demand for video grows Note: Petabyte = one million gigabytes. *CAGR = compound annual growth rate. Source: Cicso