Download
1 / 33
330 likes | 458 Vues
Risk & Return. Stand-alone and Portfolio Considerations. Efficient Market Hypothesis. Securities are in equilibrium: “Fairly priced” 100,000+ analysts (MBAs, CFAs, PhDs) work for investment firms Analysts have access to data and $$ to invest

E N D
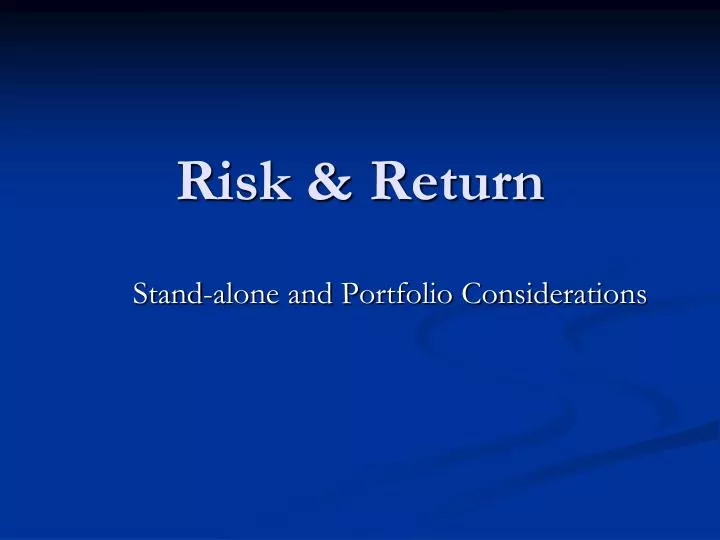
Risk & Return Stand-alone and Portfolio Considerations
Efficient Market Hypothesis • Securities are in equilibrium: “Fairly priced” • 100,000+ analysts (MBAs, CFAs, PhDs) work for investment firms • Analysts have access to data and $$ to invest • Thus, price reflects news almost instantaneously • One cannot “beat the market” except through good luck or inside information. • Doesn’t mean you can’t make money.
EMH • Weak Form EMH • Any information in historical prices is reflected in stock prices • Semi-Strong Form EMH • All public information is reflected in stock prices • Strong Form EMH • All information, even inside info, is embedded in stock prices
Return • Total dollar return • income from investment + capital gain (loss) • Percentage return • dividend yield + capital gains yield • You bought a stock for $35 and you received dividends of $1.25. The stock now sells for $40. • What is your dollar return? • What is your percentage return?
Risk • Returns generally are uncertain. • The greater the chance of a return below the expected return, the greater the risk. • Risk Premium • “Extra” return earned for taking on risk • Return above the risk free rate (Treasury bills are considered risk-free)
Stock X Stock Y Rate of return (%) -20 0 15 50 Probability Distribution
Expected Returns • Expected returns are based on the probabilities of possible outcomes • “Expected” means average if the process is repeated many times
Example: Expected Returns • What are the expected returns for Stocks C & T? State Probability C T • Boom 0.3 15% 25% • Normal 0.5 10 20 • Recession ??? 2 1 • RC = • RT =
Variance and Standard Deviation • Both measure the volatility of returns • Variance is the weighted average of squared deviations • Std. Dev. is the square root of the variance (σ)
Example: Variance and Std. Dev. • E(RC) = 9.9%; E(RT) = 17.7% • Stock C • Stock T
Example • State Prob. ABC, Inc. (%) • Boom .25 16 • Normal .50 8 • Slowdown .15 5 • Recession .10 -3 • What is the expected return, variance, and stddev? • E(R) = • Variance = • Standard Deviation =
Example • Evenly split investment between A & B • State Prob. A B • Boom .4 30% -5% • Bust .6 -10% 25% • Expected return and standard deviation • Each state • The portfolio
Another Example State Prob. X Z • Boom .25 15% 10% • Normal .60 10% 9% • Recession .15 5% 10% • What are the expected return and standard deviation for a portfolio with an investment of $6000 in asset X and $4000 in asset Z?
Types of Risk • Systematic • Risk factors that affect a large number of assets • Non-diversifiable risk, Market risk • Unsystematic • Risk factors affecting a limited number of assets • Unique risk, Asset-specific risk, Idiosyncratic risk
Portfolio Diversification • Investment in several different asset classes • 50 internet stocks - not diversified • 50 stocks across 20 industries - diversified • Can substantially reduce returns variability without reducing expected returns • A minimum level of risk cannot be diversified away
Unsystematic Risk • Diversifiable or unsystematic risk can be eliminated by combining assets into a portfolio • Total risk = systematic risk + unsystematic risk • Std. dev. of returns measures total risk • If diversified, unsystematic risk is very small
Systematic Risk • Reward for bearing risk • No reward for unnecessary risk • Beta (β) measures systematic risk • Relative to overall market • What does beta tell us? • β =1: asset has ____systematic risk as the market • β < 1: asset has ____systematic risk than the market • β > 1: asset has ____systematic risk than the market
Total versus Systematic Risk Std Dev Beta • Security C 20% 1.25 • Security K 30% 0.95 • Which has more total risk? • Which has more systematic risk? • Which should have the higher expected return?
Example: Portfolio Betas Security Weight Beta • A .2 2.7 • B .3 0.2 • C .1 2.0 • D .4 1.5 • What is the portfolio beta? • βP = w1β1 + w2β2 + w3β3 +… =
Beta and the Risk Premium • Risk premium = expected return – risk-free rate • Higher beta ~ higher risk premium • Can estimate the expected return when we know this relationship
30% 25% 20% Expected Return 15% 10% 5% 0% 0 0.5 1 1.5 2 2.5 3 Beta Beta & Returns E(RA) Rf A Slope = Rise / Run = (E(RA) – Rf) / (A – 0)
Reward to Risk Ratio • Slope of beta & return relationship • Reward to risk ratio or the risk premium • What if an asset has a reward-to-risk ratio of 8 (asset plots above the line)? • What if an asset has a reward-to-risk ratio of 7 (asset plots below the line)?
Security Market Line • SML represents market equilibrium • In equilibrium, all assets and portfolios must have the same reward-to-risk ratio • SML slope is the reward-to-risk ratio: • (E(RM) – Rf) / M = E(RM) – Rf = mkt risk premium
Risk Compensation r (%) SML Premium for Riskier Stock Market Risk Premium 8 Riskfree Rate bi 1.0 1.9
Capital Asset Pricing Model • CAPM - relationship between risk and return • E(RA) = Rf + A(E(RM) – Rf) • Risk free rate • Return for bearing systematic risk • Amount of systematic risk • If we know an asset’s systematic risk, we can use the CAPM to determine its expected return
Impact of Inflation on SML ΔInflation = 2% r (%) New SML Original SML 14 12 7 5 0 0.5 1.0 1.5 b
Impact of Risk Aversion on SML r (%) SML2 : Increased Risk Aversion rM = 18% rM = 15% SML1 18 15 ΔRPM = 3% 8 Risk,β 1.0
Example - CAPM • If the risk-free rate is 3% and the market risk premium is 8%, what is the expected return for each?
New Example • If the risk-free rate is 4% and the market risk premium is 6%, what is the expected return for each?