Download
1 / 26
260 likes | 399 Vues
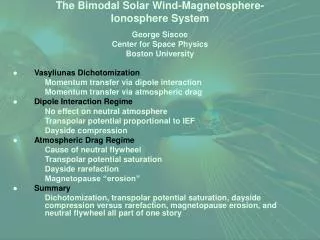
Our lazy Sun Barbara Sylwester Solar Physics Division Space Research Center, Wrocław. SOHO activity cycle; 171 Å, ~1.3 MK plasma. SOHO UV 1997 & 1999 changing activity. R ecurrent behavior of sunspots : 140 years. Butterfly diagram.

E N D
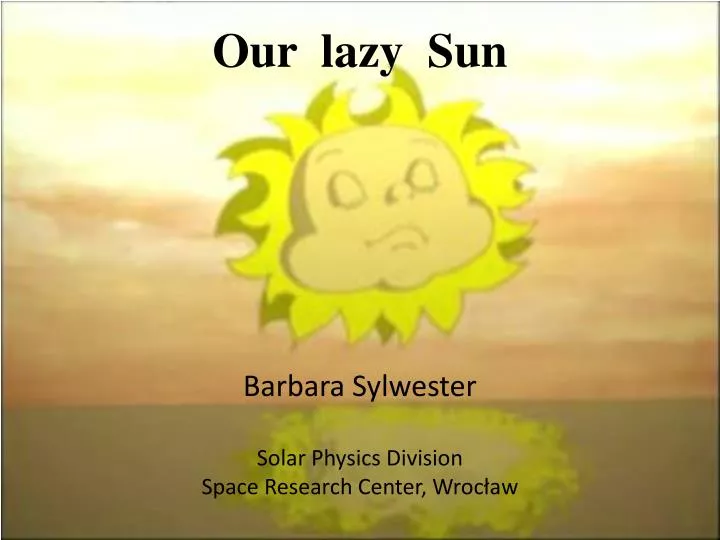
Our lazy Sun Barbara Sylwester Solar Physics Division Space Research Center, Wrocław
Recurrent behavior of sunspots:140 years Butterfly diagram Sunspots are typically confined to an equatorial belt (-35 degrees south and +35 degrees north latitude). At the beginning of a new cycle, sunspots tend to form at high latitudes, but as the cycle reaches a maximum the spots form at lower latitudes. This gives rise to the ``butterfly'' pattern first discovered by Edward Maunder in 1904.
Solar activity - proxies Red: sunspotnumber, reconstructedfromhistoricalobservations Blue: theberyllium-10 concentration(104atoms/(gram of ice)) as measuredinannuallylayeredicecore (Greenland) Rudolf Wolf, inventor of the modern sunspot number (1848, Zurich observatory).
400 years of sunspot observations 1749Carrington cycles Sporadic observations Regular sunspot number observations (from 1749) 1610 Among a huge number of revolutionary discoveries of Galileo Galilei was the first observations of sunspots using telescope. ( "And yet it does move"). 1640-1710 the coldest period of Little Ice Age (LIA) the taverns for frozen ramblers have been built at the middle of Baltic Sea ; coincidence with Maunder Minimum
6 latest cycles & solar cycles prediction During the annual Space Weather Workshop held in April 2007 the Solar Cycle 24 Prediction Panel released the prediction for the next solar cycle. They expected that the new cycle will begin in late 2007 or early 2008 – about a year later than earlier predictions. Expected peak sunspot number 140 in October, 2011. Next Cycle (25) peaking in 2022 could be one of the weakest in centuries. Predictive Flux-transport Dynamo Model Mausumi Dikpati team
11 Dec. 2007 SolarCycle 24 say: Hello ! SOHO UV-wavelength image of the Sun and a map showing positive (white) and negative (black) magnetic polarities.This region fits both criteria of new cycle: high latitude and magnetically reversed, marking it as a harbinger of a new solar cycle. Good candidate… But……the first swallow does not make a spring ….
and.…..Solar Cycle 24 official start was later 4 Jan. 2008 The large sunspot region just south of the equator is part of the waning Solar Cycle 23.
Few days later….SOHO EIT instrument This image was taken in extreme ultraviolet: 195 Å; ~ 1.6 MK. It shows the area of the solar surface where the sunspot occured whose appearing marked the start of the new solar cycle (‘Cycle 24’) on 4 January 2008. SOHO also obsered two associated „EIT waves”, blast waves that spread out from the active regions.
First southern hemisphere spots: 4.05.2008 Solar minimum is upon us ! New solarcyclehadbegundefinitely! EIT/SOHO; 284 Å; ~ 2MK
2008, September - Spotless Sun Left:A photo of the Sun taken Sept. 27, 2008. The face of the sun is "blank”. Right: The Sun on Sept. 27, 2001. The Sun's face is peppered with sunspots. The difference is the phase of the 11-year solar cycle. updated: Sept. 27, 2008 To find a year with more blank Sun, we have to go back to 1954(three years before the launch of Sputnik). 2008 the „blankest year” of the Space Age
29 September 2008; 304 Å NASA's STEREO (Ahead) spacecraft observed this prominence eruption. It rose up and cascaded to the right over several hours, appearing something like a flag headed into space. The material observed is actually ionized Helium at about 60,000 K. Prominences are relatively cool clouds of gas controlled by magnetic forces.
New cycle flare activity; Oct. 2008 6 Oct. 2008 A6.4
Signs of life …. Solar minimum behind us? A new sunspot appeared on11 Oct. 2008, the third spot seen in many weeks. New-cycle sunspot group 1007 emerges on Halloween and marches across the face of the sun over a four-day period in early November 2008.
….boring Sun on 13th Jan. 2009 captured by amateurastronomer A whole year after Solar Cycle 24 was supposed to start (when the first reversed polarity sunspot pair appeared on the Sun’s surface) the Sun is blank (featureless). However we have had flares from „left over” Cycle 23 and a bit of action from Cycle 24 (A, B class flares). 2008 was a year of overlap with both cycles weakly active at the same time.
KORONAS Photon-TESIS: 20.02.2009 18:27 UT 18:28 UT Inner corona: Fe IX 171 Å; ~1 MK He II 304; ~80 000 K 18:34 UT; Outer corona: Fe IX 171 Å; ~1 MK
20 March 2009: Where have all activity gone? SOHO MDI continuum 304 Å ; T ~ 80 000 K 284 Å ; T ~ 2 MK http://sohowww.nascom.nasa.gov/data/realtime-images.html
Progression of the solar cycle http://solarcycle24.com/ http://www.nwra-az.com/spawx/ssne-year.html Data gathered by GOES satellites which monitor solar X-rays (tracking solar flares). Solar flares can also trigger geomagnetic storms which produce aurora. The daily effective sunspot numbers over the past year. Two parameters are plotted: solid line - based on analysis of ionospheric data, and dotted line based on the observed 10.7cm solar radio flux.
Why the Sun has gone quiet? Solar dynamo…… the magnetic field lines are wrapped dipole field after many rotations lines are highly twisted and bundled the rotation rate is 20 ℅faster at the equator the resulting buoyancy lifts the bundle to the surface • something abruptly “switched off” in the inner workings of the solar dynamo ????? • the Sun has slowed it’s internal dynamo to a similar level such as was seen during the Dalton Minimum ???? • The truth is, solar activity never stops, "not even during solar minimum."
Conculding …..the „new millenium solar minimum”? The Sun is now in the quietest phase of its 11 - year activity cycle. In fact, it has been unusually quiet during 2008 year. Scientists are unsure of the significance of this unusual calm. The only way to know is to wait and see. Our closest star is continually monitoring with an array of telescopes and satellites. Probably this time next year we will be inundated with sunspots…fingers crossed.


![CME rate : 1/3 (4) day -1 at solar min (max) [LASCO CME catalogue. Yahsiro et al., 2005]](https://cdn1.slideserve.com/3309025/slide1-dt.jpg)