Download
1 / 44
460 likes | 663 Vues
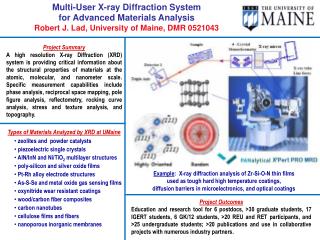
X-ray Diffraction and EBSD Jonathan Cowen Swagelok Center for the Surface Analysis of Materials Case School of Engineering Case Western Reserve University October 27, 2014. Outline. X-ray Diffraction (XRD) History and background Introduction to XRD Practical applications

E N D
X-ray Diffraction and EBSD Jonathan Cowen Swagelok Center for the Surface Analysis of Materials Case School of Engineering Case Western Reserve University October 27, 2014
Outline • X-ray Diffraction (XRD) • History and background • Introduction to XRD • Practical applications • Electron Back-Scattered Diffraction (EBSD) • Introduction to EBSD • Types of information that can be drawn from EBSD
Discovery of X-rays and Modern XRD • Wilhelm Conrad Röntgen • 1895: Discovery of X-ray • 1901: awarded first Nobel prize winner for Physics • M.T.F. von Laue: • 1912: Discovery of the diffraction of X-rays by single crystals , in cooperation with Friedrich and Knipping • Terms: Laue equation, Laue reflections • 1914: Nobel prize for Physics • W.H. and W.L. Bragg: • 1914: X-ray diffraction and Crystal Structure • Terms: Bragg‘s equation, Bragg reflections • 1915: Nobel prize for Physics
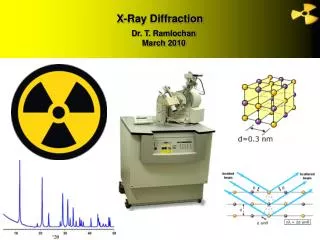
X-ray Generation X-rays Cathode e- Anode Kα=1.54Å Kβ=1.39Å Intensity Wavelength (Å) The emission spectra for Cu
Monochromatic Radiation is needed for Crystal Structure Analysis Kα Kα Intensity Mass Absorption Coefficient Kβ Filters for Suppression of Kβ Radiation Kβ The dotted line is the Mass Absorption coefficient for Ni 1.2 1.4 1.6 1.8 1.2 1.4 1.6 1.8 λ(Å) Unfiltered λ(Å) Ni Filter
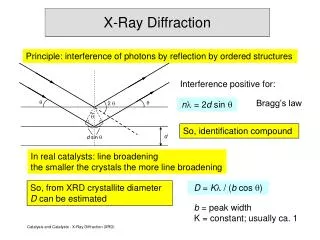
Interference and Bragg’s Law AO=OB Bragg Diffraction occurs when 2AO=nλ Sinθ=AO/d(hkl) 2d Sinθ=nλ λ=wavelength of the incident radiation Cu Kα=1.54 Å
Monochromatic X-rays using Diffraction Graphite monochromator utilizes a highly orientated pyrolytic graphite crystal (HOPG) mounted in a compact metal housing to provide monochromatic radiation. This is usually an improvement over filters. C (Graphite)
Lattice Parameter Calculation Miller Indices Bragg’s Law Knowing dhkl we can calculate the lattice parameters Silicon Powder
X-ray DiffractionDifferentiate Crystal Structures SiC C (Diamond) C (Graphite) 0.436 nm
Scintag Advanced X-Ray Diffractometer System Conventional theta-theta scan Rocking curves and sample-tilting curves Grazing angle X-ray diffraction (GAXRD) DMSNT software package is used to control the diffractometer, to acquire raw data and to analyze data. PDF-2 database and searching software for identifying phases
X-ray DiffractionTypical Patterns Amorphous Pattern Crystalline Pattern • Amorphous patterns will show an absence of sharp peaks • Crystalline patterns will show many sharp peaks • The atoms are very carefully arranged • High symmetry • From peak locations and Bragg’s Law, we can determine the structure and lattice parameters. • Elemental composition is never measured • By comparing to a database of known materials, phases can be identified
X-ray DiffractionPeak Intensities Polarization Factor Structure Factor Multiplicity Factor Lorentz Factor Absorption Factor Temperature Factor α-Al2O3
X-ray DiffractionPhase Identification International Centre for Diffraction Data (ICDD) • The PDF-2 (Powder Diffraction File) database contains over 265K entries. • Modern computer programs can determine what phases are present in any sample by quickly comparing the diffraction data to all of the patterns in the database. • The PDF card for an entry contains much useful information, including literature references. Iron Chloride Dihydrate
X-ray DiffractionPhase Identification PDF # 72-0268 Iron Chloride Hydrate Iron Chloride Dihydrate
X-ray DiffractionQuantitative Phase Analysis (QPA) • External standard method • A reflection from a pure component. • Direct comparison method • A reflection from another phase within the mixture. • Internal standard method • A reflection from a foreign material mixed within the sample. • Reference Intensity Ratio (RIR) • Generalized internal standard method developed by the ICDD. Breakdown of the PDF-2 database
X-ray DiffractionQuantitative Phase Analysis (QPA) DIFFRAC.SUITE EVA Fe 75, Ni 25 wt.%
X-ray Diffraction X ray diffraction of semi-crystalline polymer and amorphous polymer
X-ray Diffraction XRD is a primary technique to determine the degree of crystallinity in polymers. The determination of the degree of crystallinity implies use of a two-phase model, i.e. the sample is composed of crystalline and amorphous regions.
Smaller Crystals Produce Broader XRD Peaks 2nm Gold Nanoparticle Note: In addition to instrumental peak broadening, other factors that contribute to peak broadening include strain and composition inhomogeneities.
Crystallite size < 5000 Å When to Use Scherrer’s Formula t = thickness of crystallite K = constant dependent on crystallite shape (0.89) l= X-ray wavelength B = FWHM (full width at half max) or integral breadth θB = Bragg angle
X-ray DiffractionDiffraction cones arise from randomly oriented polycrystalline aggregates or powders X-ray PolycrystallineSample Diffraction Cone forms Debye Rings
X-ray Diffraction2D Detector Area Detector Debye Rings
X-ray DiffractionTypes of Detectors 2D Area detector Scintillation detector • large 2 and chi range measured simultaneously • measurement of oriented samples • very short measuring times • intensity versus 2 by integration of • the data • Small portion of Debye ring acquired • scan necessary • longmeasuring times
X-ray DiffractionBruker D8 Discover • Small Beam diameter • Can achieve 200μm • Parallel Illumination • Forgives displacement errors • 4 circle Huber goniometer • Dual beam alignment system
X-ray DiffractionOrientation Polymers, due to their long chain structure, are often highly oriented. Alignment of a sample in a drawing process causes orientation effects
X-ray DiffractionOrientation The intensity distribution of the Debye ring reveals much information about the texture of the material being studied!
X-ray Diffraction of Conch Shells In addition to identifying the CaCO3 as the Aragonite polymorph, X-ray diffraction patterns reveal a strong degree of crystallographic texture in the intact shell.
X-ray DiffractionOrientation 112 Simulated pattern of CuInSe2 204 101 224 103 211 213 Acquired XRD pattern of a thin film of CuInSe2 grown on a Mo foil substrate 112 213 204
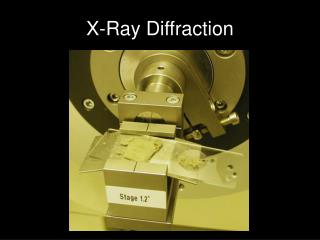
X-ray Sources Rigaku D/MAX 2200 Diffractometer
X-ray DiffractionSummary • Structure Determination • Phase Identification • Quantitative Phase Analysis (QPA) • Percent Crystallinity • Crystallite Size and Microstrain • Residual Stress Measurements (Macrostrain) • Texture Analysis • Single Crystal Studies (not a SCSAM core competency)
Electron Diffraction Zeiss Libra 200EF Polycrystal Single Crystal
EBSD – Electron Back-Scattered Diffraction in the SEM Background Corrected Pattern Averaged Background Raw Pattern
EBSD – Electron Back-Scattered Diffraction in the SEM Background Corrected Pattern Indexed Pattern 4 12 2 10 1
500 μm EBSD data – MapsBeam scan provides orientation map of polycrystalline NaCl 300×300 grid 5 μm step Analysis time: 36 minutes The colors indicate specific orientations
EBSD data – Maps polycrystalline Al2O3
A single automated EBSD run can provide a complete characterization of the microstructure: • Phase distribution • Texturestrength • Grainsize • Boundary properties • Misorientation data • Slip system activity • Intra-granulardeformation • Can collect XEDS simultaneously
bcc Fe fcc Fe bcc Fe fcc Fe EBSD Phase Discrimination Differences in interplanar angles and spacings allow similar-looking EBSD patterns from bcc and fcc Fe to be readily distinguished.
EBSD data – Maps Phase distribution, texture, grain size / shape, boundary properties, misorientation, slip system activity, intra-granular deformation.... Orientation fcc Phase map Orientation bcc
Summary • XRD is a powerful tool for answering some specific questions about a given sample. • Phases present, QPA, orientation, residual stress, texturing, and crystallite size analysis. • XRD is extremely efficient for the characterization of samples. • Sample preparation time is minimal when compared to SEM/EBSD and TEM. • Data acquisition is straight forward and short set up times are required. • XRD will provide a larger sampling area and a more accurate averaged result of the lattice parameter, but EBSD will be more site specific. • EBSD yields similar results and all the same “specific questions” can be answered in one data set!
Hough Transformation 4 12 12 2 10 1 2 4 10 1 Hough transformation Transforms x-y space to r-q space. Bands in Hough space show as points which are easier to identify and extract relative angles. -90° 0° 90°
Solution # Band triplets # votes Format of Crystal Information S3 (best solution w/most votes) S2 (2nd best solution w/ 2ndmost votes) Euler Angles using Bung convention: A rotation of φ1 about the z axis followed by A rotation of ϕ about the rotated x-axis followed by A rotation of φ2 about the rotated z-axis
Kα Kα Intensity Mass Absorption Coefficient Kβ Kβ 1.2 1.4 1.6 1.8 1.2 1.4 1.6 1.8 λ(Å) Unfiltered λ(Å) Ni Filter