Download
1 / 43
690 likes | 1.11k Vues
Multivariate Regression. 11/15/2012. Readings. Chapter 8 Correlation and Linear Regression (Pollock) ( pp 187-199) Chapter 9 Dummy Variables and Interaction Effects (Pollock Workbook) . Homework and Paper. Due 11/19- Paper Proposal. Opportunities to discuss course content.

E N D
Multivariate Regression 11/15/2012
Readings • Chapter 8 Correlation and Linear Regression (Pollock) (pp 187-199) • Chapter 9 Dummy Variables and Interaction Effects (Pollock Workbook)
Homework and Paper • Due 11/19- Paper Proposal
Office Hours For the Week • When • Friday 10-11 • Monday 11-12:15 • Tuesday 9-12
Course Learning Objectives • Students will be able to interpret and explain empirical data. • As this course fulfills the Computational Skills portion of the University degree plan, students will achieve competency in conducting statistical data analysis using the SPSS software program.
Ratio and Intervals! Regression analysis
Bivariate Linear Regression • Bivariate linear regression is an important statistical technique in the Social Sciences. It allows us to measure the effects of an independent variable on a dependent variable. • It regresses all the values on to a line that best describes the relationship.
Rules for Regression • If you have a Ratio/Interval Dependent variable that takes on at least 11 values • You need ratio level independent variables (some argue that you can use ordinals, but be careful) • If you have 30 or more cases (N>30) • If you have a linear relationship. It will not work with curvilinear or exponential relationships.
The Regression Equation! The Constant, where the line crosses the y-axis The Dependent Variable The independent variable The Slope and direction of the line
The Constant (Alpha) • Value is 42.435 • This is the value of the d.v. if the iv is zero
Betas and Independent variables • this tells us how much change in the dependent variable, is explained by the independent variable. • Every increase in religious attendance causes the d.v to move by .470 • Do we have a positive or negative relationship?
Is it a significant Relationship (T-Statistic) • This gives us a T-Statistic that tells us if we can reject the null hypothesis. • You look at the significance value to check to see if there is a relationship. The magic number for significance is .05 to reject the null and say there is a relationship! • Sig<.05, the independent variable is significant!
One More • % without health insurance (DV) • Unemployment rate (IV)
Cars of the 1970’s • Lets all try one out with the Cars database • Run a regression
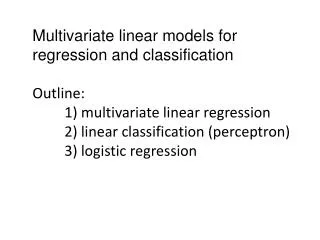
What we can do with it • Test the significance, strength and direction of more than one independent variable on the dependent variable, while controlling for the other independent variables. • We can compare the strength of each independent variable against each other • We can examine an entire model at one time!
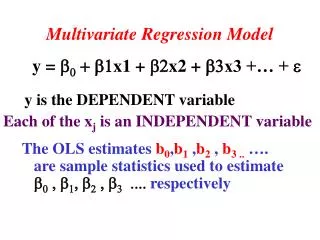
The Model • Y is the dependent variable • a is the constant • b1x1- first beta coefficient and first independent variable • b2x2- Second beta coefficient and Second independent variable
Computing a Multiple regression • You put more than one independent variable where you say "independents“ • D.V. Women09 (% of women in parliament) • IV1- womenyear2 (date of enfranchisement) • IV2- pr-sys (pr system) • IV3- pmat12_3 (postmaterialism)
Regression Outputs • These have 3 parts • The Model Summary • ANOVA • The Variables/Model
Part I Things that Begin with “r”
With So Many, How do we know? • There are many R's out there: • lower case "r" for correlation • upper case "R" for regression
Correlation (small r) • r- the pearson’s product movement • r2- The squared pearson correlation coefficient.
The R-Square (large R) • this is a measure of association for the entire model • This is a PRE measure that tells us what percent of the total variation in the dependent variable is explained by our model. • The higher the number, the better our model predicts. • We can increase the R value of our model, by increasing the number of variables, even insignificant ones!
Adjusted R-Square • this "adjusts" for the addition of independent variables. In equations with more than 1 independent variable, it will always be smaller than the R Square. • This is the preferred measure and a PRE model
What the R’s look like The R Square Adj R-Square
Part II The Analysis of variance (ANOVA)
ANOVA • A Way of testing the null hypothesis for the entire model- We Look at the F-Score • H0 = that there is not relationship between our variables and the dependent variable • HA = There is at least 1 significant variable in the model
What The F-Score tells us • It is like a chi-square for Regression. The F-score tells us if we have a significant regression model • If the F-Score is not significant, we accept the null hypothesis (no relationship). • It usually tells us at least one of our variables is significant. • It is a way of examining the entire regression.
The F-Score • We look at the Sig value and use the p<.05 measurement • In the model above, our p value is .001 • We Reject the null hypothesis • At least one variable is significant
Part III The Model
The Model • What it tells us • Variable relationships and direction • Variable significance • Variable Strength
Old Friends Beta Values T-Tests Test the significance of each independent variable on the dependent variable Accept or reject the null for that variable • Measure the change in the dependent variable • Show the direction of the relationship
Standardized Beta Coefficients • They show us the variables which have the greatest influence. • These are measured in absolute value • The larger the standardized beta, the more influence it has on the dependent variable.
Looking at our Model T-Score- Significance Beta Values
Texas Poverty • Data • http://myweb.stedwards.edu/brianws/3328fa12/texas3.sav • Dependent Variable • POORKIDS Child Poverty in 254 Texas Counties • Independent Variables- • MANUFACT % of earnings from manufacturing, • COLGRAD percent of those 25 or older with college degree • HISPPER Hispanic percent • BLACKPER black percent
Another One • D.V.Palin_therm-post (Feeling thermometer for Palin 0-100) • IV's • enviro_jobs (Environment vs. jobs tradeoff) 0=envir, 1=middle, 2=jobs • educ_r- education in years • Gunown- do you own a gun (1=yes, 5=no) • relig_bible_word (Is Bible actual word of God?) 1=yes, 0=No
Another one from the states • Gay Rights involves many concepts. The Lax-Phillips index uses content validity to address this issue at the state level. It examines the support for the following issues • Adoption • Hate Crimes legislation • Health Benefits • Housing Discrimination • Job Discrimination • Marriage Laws • Sodomy Laws • Civil Unions • It then averages these to get a statewide level
State Example • Dependent Variable- gay_support (higher is more supportive on Lax-Phillips) • Independent Variables • relig_import (% of people in state that say religion provides a great deal of guidance) • south (1=south, 0= NonSouth • abortlaw (restrictions on abortion)