Download
1 / 40
400 likes | 471 Vues
Explore the connection between Tropical Indo-Pacific SST anomalies and the winter Aleutian Low, analyzing model simulations and observed data to understand the complexities of the climate system.

E N D
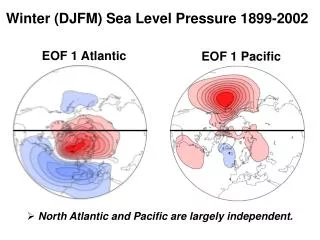
Winter (DJFM) Sea Level Pressure 1899-2002 EOF 1 Atlantic EOF 1 Pacific • North Atlantic and Pacific are largely independent.
Winter (DJFM) Sea Level Pressure 1899-2002 EOF 1 Atlantic EOF 1 Pacific • North Atlantic and Pacific are largely independent.
EOF Index Time Series(positive values = stronger westerlies) North Pacific - North Atlantic
EOF Index Time Series(positive values = stronger westerlies) North Pacific - R = 0.16 North Atlantic
Pacific Decadal Variability North Pacific - > Relationship to Tropical Pacific and Indian Ocean Climate Anomalies (Deser et al., J. Climate, 2004)
Correlation of North Pacific SLP Indexwith Tropical SST 1900-1997(December-March; 9-year low-pass filter) x -1 Positive SST with negative SLP
Correlation of North Pacific SLP Indexwith Tropical SST 1900-1997(Dec-Mar; 9-year low-pass filter) x -1 Equatorial Cold Tongue Positive SST with negative SLP
1-2-1 smoothed North Pacific SLP Equatorial Cold Tongue SST
1-2-1 smoothed North Pacific SLP Darwin SLP Equatorial Cold Tongue SST
Correlation of North Pacific SLP Indexwith Tropical SST 1900-1997(Dec-Mar; 9-year low-pass filter) x -1 Indian Ocean SE Pacific Positive SST with negative SLP
1-2-1 smoothed North Pacific SLP Indian SST SE Pacific SST
1-2-1 smoothed North Pacific SLP Indian SST SE Pacific SST • Hypothesis: Tropical Indo-Pacific SST anomalies force multi-decadal variability of the winter Aleutian Low
Testing the Tropical Forcing Hypothesis:Atmospheric GCM Experiments • NCAR CAM3 T85 resolution (1.4°lat x 1.4°lon) • Specify observed monthly SSTs (20°N-20°S) 1871 – 1949 and 1950 – 2000 (monthly climatology elsewhere) • 5 member ensembles
Results Winter North Pacific SLP Index 25/26 shift 76/77 shift Epoch Differences: Strong – Weak Aleutian Low 1977-2000 minus 1950-1976 1925-1946 minus 1900-1924
Epoch Differences: 1977-2000 minus 1950-1976 Model Ensemble Mean SSTs specified +3 hPa +1.5 hPa +0.5 hPa 0 hPa -0.5 hPa -1.5 hPa -3 hPa Observed COADS Observed Trenberth&Paolino (See also Deser and Phillips, J. Climate, Dec 2006)
Epoch Differences: 1925-1946 minus 1900-1924 Model Ensemble Mean SSTs specified +3 hPa +1.5 hPa +0.5 hPa 0 hPa -0.5 hPa -1.5 hPa -3 hPa Observed COADS Observed Trenberth&Paolino
Why are Model Epoch Differences Opposite ? 1976/77 ‘shift’ 1924/25 ‘shift’ SLP SLP Low High
Why are Model Epoch Differences Opposite ? 1976/77 ‘shift’ 1924/25 ‘shift’ SLP SLP Low High Precipitation Precipitation Dry Wet
Why are Model Epoch Differences Opposite ? 1976/77 ‘shift’ 1924/25 ‘shift’ SLP SLP Low High Precipitation Precipitation Dry Wet SST SST Cold Warm
Summary and Dilemmas • AGCM produces 1976/77 ‘shift’ but not 1924/25 ‘shift’ of winter Aleutian Low when forced with observed tropical SST anomalies. • Is AGCM response deficient? (E.g., is tropical rainfall too sensitive to SSTs along equatorial Pacific cold tongue compared to off-equatorial regions?) • Are observations deficient? (Was there a 1924/25 ‘shift’ in the climate of the tropical Indo-Pacific? How reliable is the Aleutian Low index prior to 1925?)
(*-1) Aleutian Low (inverted) 0.63 Japan – Alaska Precipitation 0.74 W. Canada Air Temp Deser et al. J. Climate 2004
1861-1880 1921-1940 1881-1900 1941-1960 1901-1920 1961-1980 Percent of months with data
Deser et al. J. Climate 2004 1-2-1 smoothed North Pacific SLP Indian Ocean SST SE Pacific SST SPCZ Rainfall Eq Pacific Rainfall Eq Pacific Cloud E-W SLP Gradient (Indian – Pac)
1976/77 ‘shift’ 1924/25 ‘shift’ MODEL MODEL OBS OBS Observed vs. Simulated Precipitation
1-2-1 smoothed North Pacific SLP Indian SST SE Pacific SST 0.42 EQ Pacific SST
Epoch Differences: 1977-2000 minus 1950-1976 1 2 3 4 5 Model Individual Ensemble Members +3 hPa +1.5 hPa +0.5 hPa 0 hPa -0.5 hPa -1.5 hPa -3 hPa
Epoch Differences: 1925-1946 minus 1900-1924 1 2 3 4 5 Model Individual Ensemble Members +3 hPa +1.5 hPa +0.5 hPa 0 hPa -0.5 hPa -1.5 hPa -3 hPa
Why are Model Epoch Differences Opposite ? 1976/77 “shift” 1924/25 “shift”
Multi-Decadal Regimes: Impact on Precipitation 1900-1924 minus 1925-1946 Alaska Japan 1947-1976 minus 1925-1946 1947-1976 minus 1977-1997 (weak minus strong Aleutian Low) Precipitation 0.5 mm d-1 Wet 0 Dry -0.5 mm d-1
Multi-Decadal Regimes: Impact on Temperature 1900-1924 minus 1925-1946 W Canada 1947-1976 minus 1925-1946 1947-1976 minus 1977-1997 (weak minus strong Aleutian Low) Temperature 1 K Warm 0 Cold -1 K
1925 1947 1977 Aleutian Low .72 TropicalIndex 1900 1950 2000
Atmospheric GCM Simulations Forced by Observed Monthly Tropical (20°N-20°S) Sea Surface Temperatures during 1950-2000 Aleutian Low Histogram Sea Level Pressure 6 CCM3 Obs Observed L # of ensemble members 4 2 CAM3 T85 (5 member ensemble) L 0 -6 -4 -2 0 2 4 6 hPa CAM3 T42 (5 member ensemble) 4 CAM3 L 3 # of ensemble members 2 CCM3 T42 (12 member ensemble) 1 0 -6 -4 -2 0 2 4 6 hPa Shading: >95% significance Winter Epoch Differences (1977-2000 minus 1950-1976)
Atmospheric GCM Simulations Forced by Observed Monthly Tropical (20°N-20°S) Sea Surface Temperatures during 1950-2000 Sea Level Pressure Observed Precipitation CAM3 T85 (5 member ensemble) CAM3 T42 (5 member ensemble) CCM3 T42 (12 member ensemble) Shading: >95% significance Winter Epoch Differences (1977-2000 minus 1950-1976) Why does CCM3 indicate no change?
Marine Cloudiness and Surface Wind Divergence from ICOADS Dashed Contours: Convergence Solid Contours: Divergence Pacific similar to GCM simulations No evidence for large precipitation increase over Indian Ocean simulated by CCM3 What Does Observed Precipitation Epoch Difference Look Like? Station Precipitation Data from Hulme et al. (1998, U.K.) More Rain, Clouds Less Rain, Clouds
CCM3 SLP Response More Rain CCM3 Rainfall Response H CCM3 - CAM3 SLP Epoch Diff. CCM3 minus CAM3 Rainfall Epoch Difference Less Rain H Dynamical Impact of Increased Indian Ocean Precipitation CCM3 forced by Indian Ocean SST epoch difference SST Epoch Difference (shading > 0.2 K)
CONCLUSIONS • According to CAM3, tropical SSTs drive much of the 1976/1977 SLP ‘shift’ over the North Pacific, in agreement with earlier studies; CCM3 simulates no ‘shift’ • Direct and indirect observations indicate no large epoch increase in rainfall over the tropical Indian Ocean as simulated by CCM3 • Erroneously large Indian Ocean rainfall increase in CCM3 is dynamically consistent with the inability of the model to simulate the 1976/1977 SLP ‘shift’ over the North Pacific • Importance of continuous high-quality tropical precipitation measurements