Download
1 / 3
30 likes | 128 Vues
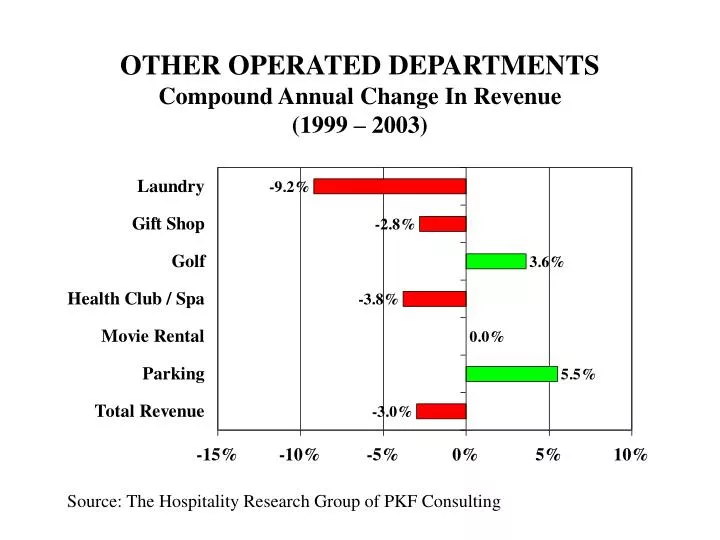
OTHER OPERATED DEPARTMENTS Compound Annual Change In Revenue (1999 – 2003). Source: The Hospitality Research Group of PKF Consulting. OTHER OPERATED DEPARTMENTS* 2003 Dollars Per Available Room. Note: * Data for each revenue source derived from a unique sample.

E N D
OTHER OPERATED DEPARTMENTSCompound Annual Change In Revenue(1999 – 2003) Source: The Hospitality Research Group of PKF Consulting
OTHER OPERATED DEPARTMENTS*2003 Dollars Per Available Room Note: * Data for each revenue source derived from a unique sample. Source: The Hospitality Research Group of PKF Consulting
OTHER OPERATED DEPARTMENTS*2003 Percent Of Total Revenue Note: * Data for each revenue source derived from a unique sample. Source: The Hospitality Research Group of PKF Consulting