Download
1 / 35
360 likes | 400 Vues
Units of Measurement. Courtesy: www.lab-initio.com. Quantitative observation = measurement. Two Parts. Number. Unit. Both must be present for measurement to have meaning!! Two major systems: English system (used in the US) and the metric system (used by most of rest of the world).

E N D
Units of Measurement Courtesy: www.lab-initio.com
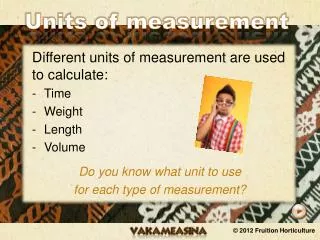
Quantitative observation = measurement Two Parts Number Unit • Both must be present for measurement to have meaning!! • Two major systems: English system (used in the US) and the metric system (used by most of rest of the world). • Scientists worldwide use the metric system.
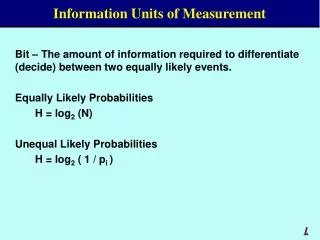
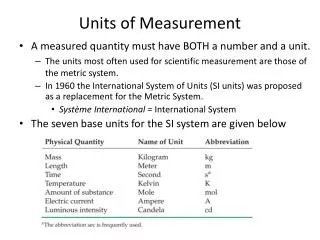
In 1960, the International System of units was created and is known as the SI system. Fundamental SI Units
Prefixes are used to change the size of fundamental SI units.
Volume has the dimensions of (distance)3. • Example: length x width x height • Derived SI unit = cubic meter (m3). Volume • Traditional metric unit of volume is the liter (L). • In SI terms, 1 L = 1 dm3. • Normally we measure volumes in lab in units of milliliters (mL). • 1000 mL = 1L
Mass versus Weight • Mass – the quantity of matter in an object • Measured using a balance. • Weight – the force exerted on an object by gravity. • Measured using a spring scale.
Uncertainty in Measurement • When a person uses a measuring device such as a buret or a ruler, there is always uncertainty in the measurement. • In other words, the last digit in a measurement is always estimated. • The uncertainty of a measurement depends on the precision of the measuring device.
Consider the measurement of volume from the buret. • Suppose 5 different people read this buret and the following measurements are obtained. • Person Measurement • 1 20.15 mL • 2 20.14 mL • 3 20.16 mL • 4 20.17 mL • 5 20.16 mL • The first 3 digits are all the same; these are digits read with certainty. • The last digit is estimated and is called the uncertain digit.
Consider the two centimeter rulers at the left. • Each ruler is measuring the same pencil. • The best measurement obtained from the first ruler would be 9.5 cm. • The best measurement obtained from the second ruler would be 9.51 cm. • Why two different measurements? • The second measurement is more precise, because you used a smaller unit to measure with. • Digits that result from measurement such that only the digit farthest to the right is not known with certainty are called significant figures.
Precision and Accuracy • Precision – the degree of agreement among general measurements of the same quantity (how reproducible your measurements are). • Accuracy – the agreement of a particular value with the true value.
Random errors mean that a measurement has an equal probability of being high or low. Occurs in estimating the value of the uncertain digit. • Systematic errors occur in the same direction each time; they are always high or always low. • Figure (a) indicates large random errors (poor technique). • Figure (b) indicates small random errors but a large systematic error. • Figure (c) indicates small random errors and no systematic error.
Example: Precision and Accuracy • Each of 4 general chemistry students measured the mass of a chemistry textbook. They each weighed the book 4 times. Knowing that the true mass is 2.31 kg, which student weighed the book: • a. accurately and precisely • b. inaccurately but precisely • c. accurately but imprecisely • d. inaccurately and imprecisely • Weighingstudent #1student #2student #3student #4 • 1 2.38 kg 2.06 kg 2.32 kg 2.71 kg • 2 2.23 kg 1.94 kg 2.30 kg 2.63 kg • 3 2.07 kg 2.09 kg 2.31 kg 2.66 kg • 4 2.55 kg2.40 kg2.32 kg2.68 kg • Average: 2.31±0.16 kg 2.12±0.14 kg 2.31±0.01 kg 2.67±0.03kg
Solution: You have to ask yourself two questions about each data set: Is the average close to the accepted (true) value? If it is, then the result is accurate. Is the average deviation small relative to the actual value? If it is, then the result is precise. Student #1 2.38 kg 2.23 kg 2.07 kg 2.55 kg 2.31±0.16 kg Student #2 2.06 kg 1.94 kg 2.09 kg 2.40 kg 2.12±0.14 kg Student #3 2.32 kg 2.30 kg 2.31 kg 2.32 kg 2.31±0.01 kg Student #4 2.71 kg 2.63 kg 2.66 kg 2.68 kg 2.67±0.03 kg Student #1 – accurate but imprecise Student #2 – inaccurate and imprecise Student #3 – accurate and precise Student #4 – inaccurate but precise
Significant Figures • When taking measurements all certain digits plus the uncertain digit are significant. • Example: Your bathroom scale weighs in 10 Newton increments and when you step onto it, the pointer stops between 550 and 560. You look at the scale and determine your weight to 557 N. You are certain of the first two places, 55, but not the last place 7. The last place is a guess and if it is your best guess, it also is significant.
When given measurements, the numbers that are significant are the digits 1 – 9, and the 0 when it is not merely a place holder. • When 0’s are between significant figures, 0’s are always significant. • Example:101 has 3 sig. fig. and 34055 has 5 sig. fig. • When the measurement is a whole number ending with 0’s, the 0’s are never significant. • Example:210 has 2 sig. fig. and 71,000,000 also has 2 sig. fig. • Removal of the 0’s DO change the value (size) of the measurement, but the 0’s are place holders and are thus not significant.
When the measurement is less than a whole number, the 0’s between the decimal and other significant figures are never significant (they are place holders). Example: 0.0021 has 2 sig. fig. and 0.0000332 has 3 sig. fig. Removal of the 0’s DO change the value (size) of the measurement, the 0’s are place holders and are thus not significant. When the measurement is less than a whole number and the 0’s fall after the other significant numbers, the 0’s are always significant. Example: 0.310 has 3 sig. fig. and 0.3400 has 4 sig. fig. The 0’s have no effect on the value (size) of the measurement. Therefore, these 0’s must have been included for another reason and that reason is to show precision of the measurement. Since these 0’s show precision they must be significant.
When the measurement is less than a whole number, and there is a 0 to the left of the decimal, the 0 is not significant. Example: 0.02 has only 1 sig. fig. and 0.110 has 3 sig. fig. The 0 to the left of the decimal is only for clarity, it is neither a place holder nor adds to the accuracy of the measurement. When the measurement is a whole number but ends with 0’s to the right of the decimal, the 0’s are significant. Example:20.0 has 3 sig. fig. and 18876.000 has 8 sig. fig. The 0’s have no effect on the value (size) of the measurement. Therefore, these 0’s must have been included for another reason and that reason is to show precision of the measurement. Since these 0’s show precision they must therefore be significant.
Rules for Significant Figures in Mathematical Calculations For addition or subtraction, the result has the same number of decimal places as the least precise measurement (the measurement with the least number of decimal places) used in the calculation. Example: 12.011 18.0 1.013 ________ 31.123 Limiting term has one decimal place Corrected 31.1 One decimal place
When adding or subtracting numbers written with the ± notation, always add the ± uncertainties and then round off the ± value to the largest significant digit. Round off the answer to match. Example: (22.4 ± 0.5) + (14.76 ± 0.25) = 37.16 ± 0.75 = 37.2 ± 0.8 The uncertainty begins in the tenths place… it is the last significant digit.
For multiplication or division, the number of significant figures in the result is the same as the number in the least precise measurement (the measurement with the least number of significant figures) used in the calculation. Example: 4.56 x 1.4 = 6.38 Corrected 6.4 Two significant figures Limiting term has two significant figures Example: How should the result of the following calculation be expressed? 322.45 x 12.75 x 3.92 = 16116.051 = 16100 (3 sig. fig.)
Rules for Rounding • In a series of calculations, carry the extra digits through to the final result, then round. • If the digit to be removed • is less than 5, the preceding digit stays the same. For example, 1.33 rounds to 1.3. • is equal to or greater than 5, the preceding digit is increased by 1. For example, 1.36 rounds to 1.4.
Order of Operations • You will often have to solve problems where there is a combination of mathematical operations. To get reasonable answers, you need to recall your order of operations, given the following table: • Order of Operations • parentheses • exponents and logs • multiplication and division • addition and subtraction
Exponential Notation (or Scientific Notation) • Review Appendix A1.1 and handout.
Dimensional Analysis • Dimensional analysis (or unit factor method) – used to convert from one system of units to another. • In dimensional analysis we treat a numerical problem as one involving a conversion of units from one kind to another. • To do this we need one or more conversion factors (unit factors) to change the units of the given quantity to the units of the answer. • A conversion factor is a fraction formed from a valid relationship or equality between units that is used to switch from one system of measurement and units to another.
For example, suppose we want to express a person’s height of 72.0 in. in centimeters. • We need relationship or equality between inches and centimeters. • 2.54 cm = 1 in. (exactly) • If we divide both sides by 1 in., we obtain a conversion factor. • Notice we have canceled the units from both the numerator and the denominator of the center fraction. • Units behave just as numbers do in mathematical operations, which is a key part of dimensional analysis.
Now let’s multiply 72.0 in. by this fraction: 3 sig. fig. 3 sig. fig. • Because we have multiplied 72.0 in. by something that is equal to 1, we know we haven’t changed the magnitude of the person’s height. • We have changed the units (notice that inches cancel leaving centimeters which is what we wanted). • Notice that our given quantity and desired quantity have the same number of significant figures (conversion factors are considered exact numbers and do not dictate significant figures).
One of the benefits of dimensional analysis is that it lets you know when you have done the wrong arithmetic. • From the relationship • 2.54 cm = 1 in. • we can construct two conversion factors. • In the previous problem what if we used the incorrect conversion factor? Would it make a difference in our answer? • None of our units cancel. • In this case we get the wrong units!!!!
Can we use more than one conversion factor in a single problem? • Example: • In 1975, the world record for the long jump was 29.21 ft. What is this distance in meters? • Solution: We can state this problem as • 29.21 ft = ? m • One of several sets of relationships we can use is • 1 ft = 12 in. • 1 in. = 2.54 cm • 100 cm = 1 m • Notice they take us from inches to centimeters to meters.
Notice if we had stopped after the first conversion factor, the units of the answer would be inches; if we stop after the second, the units would be centimeters, and after the third we get meters – the units we want. • Note: this is not the only way we could have solved this problem. Other conversion factors could have been chosen. • Important: you should be able to reason your way through a problem and find some set of relationships that can take you from the given information to the answer.
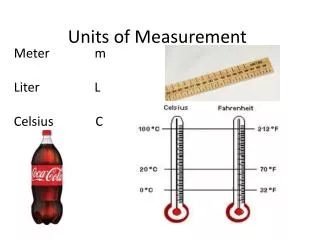
Temperature Three systems: Celsius scale Kelvin scale Fahrenheit scale
Note the size of the temperature unit (the degree) is the same for the Kelvin and Celsius scales. • The difference is in their zero points. • To convert between Kelvin and Celsius scales add or subtract 273.15. Temperature (Kelvin) = temperature (Celsius) + 273.15 Temperature (Celsius) = temperature (Kelvin) – 273.15 Unit for Celsius = oC Unit for Kelvin = K No degree symbol
To convert between the Celsius and Fahrenheit scales two adjustments must be made: • degree size • zero point Zero Point Degree size 32o F = 0oC Subtract or add 32 when converting 180o F = 100oC Conversion factor = or the reciprocal
Density • Property of matter used by chemists as an “identification tag”. • Density = mass of substance per unit volume of the substance • Each pure substance has a characteristic density. • Density can also be used to convert between mass and volume.
Be able to manipulate the formula for density. • If given the density and mass of a substance how could you determine volume? • If given the density and volume of a substance how could you determine mass? • Remember!! A material will float on the surface of a liquid if the material has a density less than that of the liquid.