Download
1 / 18
260 likes | 623 Vues
EDU 702 RESEARCH METHODOLOGY. CORRELATIONAL RESEARCH. MARLINA BT ZUBAIRI NORLIN BT ABD GHAFAR FARADILLAH BT MD RAMLI ZURIANA BT SAARI. Definition. To identify the relationships between two or more variables

E N D
EDU 702 RESEARCH METHODOLOGY CORRELATIONAL RESEARCH MARLINA BT ZUBAIRI NORLIN BT ABD GHAFAR FARADILLAH BT MD RAMLI ZURIANA BT SAARI
Definition • To identify the relationships between two or more variables • Relationship the range of score on one variable is associated with the range of score of the other variable
When to use • As a first step prior to experimentation • When experiments cannot be conducted (e.g. for ethical reason) • Data collected through : - observations - surveys and questionnaire - archived information
Characteristics • Variables cannot be manipulated • Cannot prove a causal relationship • Only examine the possibilities that one variable might cause something to happen
Purpose • Help us to understand related events, conditions and behaviours : explanatory studies • To make predictions of how one variable might predict another : prediction studies • Variables used : i) predictor variable ii)criterion variable
The procedure Problem Selection Data Analysis and Interpretation Sample Data Collection Instrument Design and Procedures
1. Problem selection • Based on experience or theory • 3 types of problems : • Is variable X related to variable Y? • How well does variable P predict variable C? • What are the relationships among a large no. of variables, and what predictions can be made that are based on them?
2. Sample • ?appropriate population • < 30 = inaccurate estimate of the degree of the relationship • > 30 = provide meaningful results.
3. Instruments • Choose appropriate instruments • Must yield quantitative data. • Administrating instruments – e.g.: test, questionaires etc. • Observation • Must show evidence of validity
4. Data collection • Explanatory study – short time needed to collect data on both variables • Prediction study – longer time needed to measure the criterion variables compared to prediction variables.
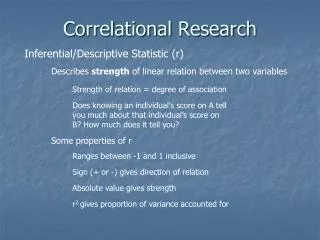
5. Data analysis and interpretation • Correlation coefficient is produced when variables are correlated. • In decimals between 0.00 and +1.00 or -1.00.
Data analysis • If closer to +1.00 or -1.00 = stronger relationship • If + sign = high scores on both variables. • If – sign = high on one v but low on the other. • If at / near 0.00 = no relationship exists
Data analysis r scores range from -1 to +1 r= +1, perfect positive relationexample of a positive r: GPA and scores on SAT r= -1, perfect negative relationexample of a negative r: drinking in college and GPA r= 0, no relationexample of a near zero r: hair length and GPA
Examples of topic • Example - Health psychologist is interested in testing the claim that people with more friends tend to be healthier. • Example - Health psychologist described surveys two groups of people: hospital patients being treated for chronic diseases and healthy community members.
Correlation example • High Self-esteem (A) and GPA (B) Is (A) related to (B)? Or is it the other way around? Or, are there other factors that cause both (A) and (B)? • Raw Data:
Correlation example See scatter plot of data
Correlation example • Two independent conducted studies found that there is no causal relationship between these two factors. They are correlated because both of them are correlated to some other factors: intelligence and family social status. **Correlations do NOT tell us that one variable CAUSES the other variable
Conclusion • Strengths • Can study a broad range of variables • Can look at multiple variables at one time • Large samples are easily obtained • Weaknesses • Relationships established are associational, not causal • Individuals not studied in-depth • Potential problems with reliability and validity of self-report measures