Download
1 / 53
530 likes | 538 Vues
This article explores the development of composite child well-being indices based on objective social indicators and subjective well-being studies. It discusses the importance of expert consensus and the potential for using empirical data to inform the selection of domains and indicators. The Child Well-Being Index (CWI) is presented as an example of a evidence-based composite index for measuring trends in the well-being of children and youth in the United States.

E N D
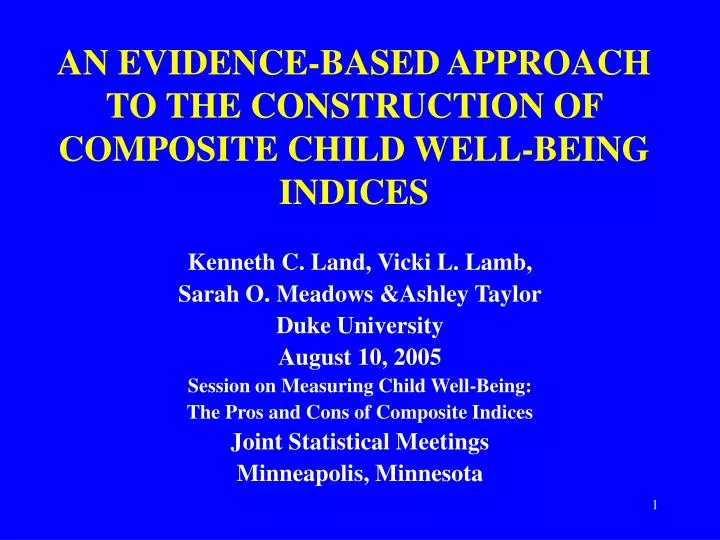
AN EVIDENCE-BASED APPROACH TO THE CONSTRUCTION OF COMPOSITE CHILD WELL-BEING INDICES Kenneth C. Land, Vicki L. Lamb, Sarah O. Meadows &Ashley Taylor Duke University August 10, 2005 Session on Measuring Child Well-Being: The Pros and Cons of Composite Indices Joint Statistical Meetings Minneapolis, Minnesota
In the beginning:“… social indicators – statistics, statistical series, and all other forms of evidence – that enable us to assess where we stand and and are going with respect to our values and goals…” -- Raymond A. Bauer, Social Indicators, 1966, p. 1, MIT Press
“A social indicator… may be defined to be a statistic of direct normative interest which facilitates concise, comprehensive and balanced judgments about the condition of major aspects of a society.”-- Mancur Olson, Principal Author, Toward a Social Report, 1969, p. 97, USDHEW
“… we propose… to ‘monitor the quality of American life’ … our concern was with the experience of life rather than the conditions of life… [we] define the quality of life experience mainly in terms of satisfaction [with life and specific life domains]-- Angus Campbell, Philip E. Converse, and Willard L. Rodgers, The Quality of American Life: Perceptions, Evaluations, and Satisfactions, 1976, pp. 7,9, Russell Sage Foundation.
Various observers (e.g., Land 2000; Noll 2002) have noted that these “founding definitions” of the social indicators and quality-of-life concepts have led to two major lines of development over the past 30+ years:(1) Objective Social Indicators: This line of development began with the Bauer (1966) volume and extends to the present. The emphasis is on the development of statistics that reflect important “social conditions” and the monitoring of trends in a range of “areas of social concern” over time.
The key undefined terms here require the identification of: • the “social conditions” to be measured, and • the “areas of social concern” for which trends are to be monitored.
Since the 1970s, the primary approach to the identification and definition processes has been through the creation of “expert” panels of social scientists, statisticians, and citizens. These panel have applied a variety of approaches to their work, such as: -- the “indicators of social change” approach (Sheldon and Moore 1968); -- the Swedish “level of living” approach (Erickson 1974); and -- the “goals commissions” approach (e.g., the U.S. Healthy People 2010 Goals).
The key element of this approach is that the experts must achieve consensus. Specifically, as Noll (2002, p. 175) notes, there must be consensus on: • the conditions and areas of concern to be measured; • good and bad conditions; and • the directions in which society should move.
(2) Subjective Social Indicators, Subjective Well-Being, Happiness, and Satisfaction: This line of development commenced with the Campbell, Converse, and Rodgers (1976) volume cited above and the Andrews and Withey (1976) volume, Social Indicators of Well-Being: Americans’ Perceptions of Life Quality published in the same year.
Some conclusion about the quality of life based on comparisons of findings across numerous subjective well-being studies (Cummins 1996, 1997; (Huebner 1991 ): -- there is a potential for tremendous variety of assessments of satisfaction with life experiences, with individuals often differing in their ratings of importance of the key elements associated with their life satisfactions and happiness;
-- but, at the same time, the accumulation of findings across many studies shows that certain domains of well-being occur over and over again; -- there also is a fairly high degree of similarity among individuals on the relative weightings given to these domains in determining overall life satisfaction;
-- and, perhaps most interestingly, there is a lot of similarity between the domains of well-being identified in subjective well-being studies and the areas of concern identified by expert panels in objective social indicators studies.
This naturally leads to the: Question: -- Can the empirical findings from subjective well-being studies about domains of well-being be used to inform the construction of composite quality-of-life indices? -- That is, can subjective well-being studies be used to make summary quality-of-life indices more evidence-based not only in the use of empirical data, but also in the selection of the domains of well-being and indicators used in their construction?
THE CHILD WELL-BEING INDEX (CWI) As an exploration of this possibility, consider the Child Well-Being Index recently developed by Land, Lamb, and Mustillo (2001).
The Child Well-Being Index is: -- a summary measure of trends over time in the well-being of America’s children and young people -- that consists of several interrelated summary indices of annual time series of numerous social indicators of the well-being of children and youth in the United States.
The objective of the CWI summary indices is to: -- give a sense of the overall direction of change in the well-being of children and youth in the U.S. as compared to two base years, 1975 and 1985.
The CWI is designed to address questions such as the following: • Overall, on average, how did child and youth well-being in the U.S. change in the last quarter of the 20th century and beyond? • Did it improve or deteriorate? • By how much? • In which domains of social life? • For specific age groups?
For particular race/ethnic groups? • For each of the sexes? • And did race/ethnic group and sex disparities increase or decrease?
Methods of Construction Annual time series data (from vital statistics and sample surveys) have been assembled on some 28 national-level Key Indicators in seven quality-of-life domains: • Family Economic Well-Being, • Health, • Safety/Behavioral Concerns, • Educational Attainments,
Community Connectedness, • Social Relationships (with family and peers), and • Emotional/Spiritual Well-Being.
These seven domains of quality of life have been well-established in over two decades of empirical research in numerous subjective well-being studies (Cummins 1996, 1997). They also have been found, in one form or another, in studies of the well-being of children and youths (Huebner 1991).
Table 1. Twenty-eight Key National Indicators of Child Well-Being in the United States
Some Notes About the Twenty-Eight Indicators: • Note 1: Unless otherwise noted, indicators refer to children ages 0-17. • Note 2: With the exception of the indicators of health insurance coverage, subjective health assessments, and activity limitations, which begin 1987, 1984, and 1984, respectively, all of the indicator series date back at least to 1975. • Note 3: Most of the indicator series in the table are reported annually. • The exceptions are the reading and test scores (from the National Assessment of Educational Progress), the obesity prevalence rates (from the National Health and Nutrition Examination Surveys (NHANES)), and the voting in presidential election years percentages (which necessarily occur on four-year cycles). The NAEP test scores originally began on a five-year cycle in 1975, changed to a two-year cycle in 1985, and then changed to a four-year cycle in 1999. Since these time series change quite smoothly, however, they quite easily can be interpolated to an annual basis. The obesity data from the NHANES studies were collected in cycles spanning the years 1971-1974, 1976-1980, and 1988-1994. To fit with the annual spacing of the other time series in the table, these data also have been interpolated for the intervening years. And, similarly, the voting percentages were interpolated to an annual basis from the four-year cycles of presidential elections.
To calculate the CWI, each of the 28 time series of the Key Indicators is indexed by a base year (1975 or 1985). The base year value of the indicator is assigned a value of 100 and subsequent values of the indicator are taken as percentage changes in the index. The directions of the indicators are oriented so that a value greater (lesser) than 100 in subsequent years means the social condition measured has improved (deteriorated).
The 28 indexed Key Indicator time series are grouped into the seven domains of well-being by equal weighting to compute the domain-specific Index values for each year. The seven domain-specific Indices then are grouped into an equally-weighted Child Well-Being Index value for each year. Hagerty and Land (2003) show that an equal-weighting strategy for summary indicators of well-being is privileged in that it minimizes disagreement among all possible individuals’ weights
Since it builds on this empirical base, the CWI can be viewed as well-being-evidence based measure of trends in averages of the social conditions encountered by children and youth in the U.S. across recent decades.
Some Findings Using the CWI:(1) A Domain-Specific Report Card for 2003 Change from 2002 to 2003Domain as a Percent of Base Year 1975 ValueFamily Economic Well-Being -1.15Health -2.08Safety/Behavioral +5.61Educational Attainment No ChangePlace in Community +2.10Social Relationships +0.54Emotional/Spiritual -2.37
Trends in Child Well-Being Over the Past Quarter Century and Into the 21st Century The following charts show changes over time in the CWI and its various components.
In summary, analyses of the CWI show: • The overall well-being of children and youth in the U.S. showed substantial improvements in the eight years from 1994 to 2002. • Improvements continued at a slower pace in 2003, and also likely continued in 2004. • Child well-being in the U.S. deteriorated fairly steadily for a number of years in the 1980s and reached low points in 1992-94. They then began the upturn of the past several years.
Recent increases in the CWI have pierced the 1975 base year level only in the past few years. • The downturn in well-being that occurred in the 1985-1994 period was particularly severe for black and Hispanic children and youths. • There have been overall improvements in well-being for both males and females since 1985, but there are some domains and indicators in which males have done better and some in which females have done better.
Historical best-practice analyses using the best values on each of the component indicators of the CWI ever recorded for the U.S. show that the CWI could be 20 to 25 percent higher than its values in recent years. • International best-practice analyses using the best values of the of the component indicators recorded in recent years by other nations show that the CWI could be 35 to 40 percent higher than its value in recent years.
Sensitivity analyses of the CWI show that the Health domain sub-index is greatly impacted by the inclusion of the indicator for trends in obesity and this indicator also has a big impact on the childhood well-being index. • The CWI also helps identify domains of well-being for which the data base needs to be improved. Component indicators for the social relationships and emotional well-being domains are particularly weak.
The CWI shows substantial covariation with a smoothed “global life satisfaction” time series from 12th graders in the MTF Project, which provides validating evidence for changes in the CWI as measuring changes in the quality of life of children and youth. • The qualitative pattern of change in an expanded CWI (with 44 Key Indicator time series) is shown to be similar to those of the basic CWI, except that the expanded CWI shows a more pronounced decline in the early-1990s and a slower rate of improvement into the early-2000s.
TOPIC 3: CAN WE DO MORE?Two needed developments: (1) The construction of corresponding child well-being indices (insofar as databases permit) at the state and local levels, as shown in the next chart, a project that is underway in collaboration with KIDS COUNT.
Hierarchical Relationships Among the CWI, Domain Indices, Indicators, and Scientific Studies St/Loc-Level CWI • National-Level CWI St/Loc-Level Domain-Specific Indices Domain-Specific Indices Indicators Within Domains St/Loc-Level Indicators Within Domains • Social Science and Epidemiological Studies of Correlates and Causes
(2) A further articulation and application of the teleological process described in Land and Ferriss (2002) to the CWI and its component indicators, as illustrated in the next chart.
Cause Effect Experiments Sequence PracticalExperience Programs Resources ProgramImplementationCycle SocialConditions CWI And Its Component Indicators Goals provideknowledge of providesknowledge of determines applied to through such as For Example: Healthy People:2010 impact such as For Example: Infant MoralityRate Prevelance of Cigarette Smoking Obesity measured by measure progress toward
The Child Well-Being Index On the Web: http://www.soc.duke.edu/%7Esmeadows/cwi/cwi_webpage/