Download
1 / 28
310 likes | 509 Vues
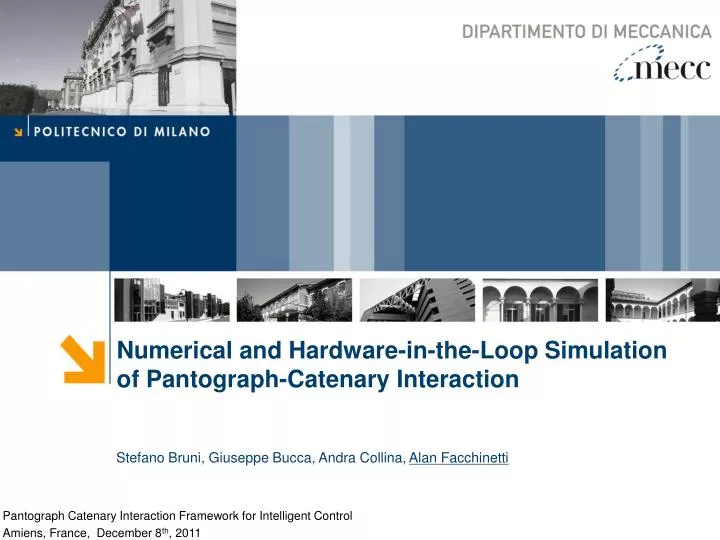
Numerical and Hardware-in-the-Loop Simulation of Pantograph-Catenary Interaction. Stefano Bruni, Giuseppe Bucca, Andra Collina, Alan Facchinetti. Introduction. The assessment of the performance of a given pantograph-catenary system is usually based on line measurements

E N D
Numerical and Hardware-in-the-Loop Simulation of Pantograph-Catenary Interaction Stefano Bruni, Giuseppe Bucca, Andra Collina, Alan Facchinetti
Introduction • The assessment of the performance of a given pantograph-catenary system is usually based on line measurements • Experimental test runs are extremely time-consuming and expensive • The availability of simulation tools for pantograph-catenary dynamic interaction is essential or at least can reduce the number of required line tests for: • design of new systems • optimisation of existing systems • interoperability analyses • virtual homologation (PantoTRAIN) • …
Contents of the presentation • Mathematical model and numerical simulation of pantograph-catenary interaction • Hybrid simulation of pantograph-catenary interaction • Comparison of the simulation tools with line measurements • Effect of contact strip deformability • Effect of contact dynamics on contact wire wear • Concluding remarks
Mathematical model of pantograph-catenary interaction • The development of a mathematical model for pantograph-catenary dynamic interaction started at Politecnico di Milano several years ago • Cooperation with Italferr and former FS (Italian State Railways), now RFI (Rete Ferroviaria Italiana) • Simulation tool mainly intended for the assessment of current collection quality, continuously updated • Software was successfully applied: • to the design of the new Italian 25 kV a.c. high speed line • for the upgrading of the existing Italian 3 kV d.c. line • for the design of several applications world-wide, in support of the main overhead line suppliers.
Mathematical model: the catenary model Traditional wire droppers Elastic ring dropper • Finite element schematisation of the contact wire and of the messenger wire • Droppers included as non linear element(non-linear characteristic obtained fromlaboratory tests)
Mathematical model: the pantograph model • Pantograph represented as a non-linear lumped parameter system (identification from experimental FRF) • Bending deformability of the collectors introduced by modal superposition approach (impact tests on the single collector)
Mathematical model: the interaction model Contact law (penalty method) Catenary motion Fc Collector motion Fc
Hybrid (HIL) simulation of pantograph-catenary interaction 8 Real-time catenary model
Hybrid simulation: the HIL test-rig 9 Lateral actuation (stagger) Electromechanicalup to ±400mm @ 360 km/h Vertical actuation 2 independent hydraulic actuatorsup to 25 Hz Load cells
Hybrid simulation: the catenary model traction compression • 3-5 spans (periodic structure) • CW and MW represented through modal superposition approach (tensioned beams) • Effect of droppers’ slackening • “Shift forward” procedure
Comparison of numerical simulation with line measurements ATR95 pantograph - C270 catenary (25 kV a.c.) V = 300 km/h Time histor of the contact force (approximately 3 spans) 1/3 octave band frequency spectra of the contact force CW irregularity was considered in the numerical simulation
Comparison of hybrid simulation with line measurements ATR95 pantograph - C270 catenary (25 kV a.c.) V = 300 km/h Time history of the contact force (approximately 3 spans) 1/3 octave band frequency spectra of the contact force
Comparison with line measurements ATR95 pantograph - C270 catenary (25 kV a.c.) V = 300 km/h
Effect of contact strip deformability (numerical simulation)
Effect of contact strip deformability (numerical simulation) V=270 km/h without deformability V=330 km/h V=270 km/h with deformability V=330 km/h Spectra of the vertical accelerations of the front collector Contact losses percentage
Effect of contact dynamics on contact wire wear (numerical simulation) Procedure for the estimation of wear evolution V A Fc Numerical simulation of the pantograph-catenary interaction Evolution of CW irregularity (single passage) Wear modelA=f(Fc,i,V) i N pass. Initial irregularity
The wear model Wear modelA=f(Fc,i,V) Heuristic model of contact wire wear, tuned on the basis of experimental data Electrical contribution Mechanical contribution A = worn area, Fc = contact force, i = current intensity, V = sliding speed,H = hardness of CW material, F0, i0, V0 = reference value, R(Fc) = electrical contact resistanceα, β, k1 and k2 identified from experimental data
Test rig for the study of wear behaviour of contact strip and contact wire The test-rig enables the testing of full scale collectors at speeds up to 200 km/h, imposing electrical current intensity up to 1200 A dc, 500 A ac 162/3 Hz and 350 A ac 50 Hz.
Test rig for the study of wear behaviour of contact strip and contact wire
Test rig for the study of wear behaviour of contact strip and contact wire Rotating fibre-glass disk (R = 2 m) Contact wire
Test rig for the study of wear behaviour of contact strip and contact wire Collector Hydraulic actuator
Test rig for the study of wear behaviour of contact strip and contact wire Ventilation apparatus
Results from wear tests: contact resistance Contactresistance vs contact force
Results from wear tests: Contact wire Specific Wear Rate CW SWR vs contact force CW SWR vs current Vlm = volume of lost material [mm3] s = travelled distance [km] FC= Contact force [N]
Results from wear tests: Contact wire Specific Wear Rate k1, k2, α and β
mid Evolution of the worn area of the contact wire Comparison between numerical results for two different values of the mechanical tension of the contact wire, i.e. 17 kN and 20 kN
Concluding remarks • The numerical simulation and hybrid co-simulation represent useful means to investigate the pantograph-catenary dynamic interaction before line-testing • The degree of accuracy that can be obtained with these two techniques is more than satisfactory • Mathematical models can also give some insight into some of the phenomena involved in pantograph-catenary interaction, e.g. the effects of collector deformability and wear process concerning contact wire and collector strip Thank you for your attention