Download
1 / 41
410 likes | 550 Vues
Day 2. ACT Dashboard Inquiry. Welcome Back!. ACT Entry Points. Consider the Accountability School Report Card as an Entry Point for Data Study. ON-TRACK ACT Participation and Performance. Sample from High School Report Card. ACT Question Topics. ACT, PLAN AND EXPLORE BENCHMARKS.

E N D
Day 2 ACT Dashboard Inquiry Finco & Torkelson
Welcome Back! Finco & Torkelson
ACTEntry Points • Consider the Accountability School Report Card as an Entry Point for Data Study • ON-TRACK • ACT Participation and Performance Sample from High School Report Card
ACT, PLAN AND EXPLORE BENCHMARKS • Use these college readiness benchmark scores when analyzing results for the EXPLORE and PLAN, in addition to the ACT.
About the ACT Dashboard • Data is provided for the previous years (not current). • Note the six summary graphs for ACT results. • Note that “English” is the default subject selection. • Use the filters and related dashboards to view ACT data for subgroups. • View year-by-year trends.
Thinking Ahead about“Drilling-Down” • Think ahead about ACT detail investigationsthat are important. • Some helpful “drill-down” investigations when studying ACT results. • What are the demographics of students who take the ACT and of those who do not? • In which subject areas do students have the most difficulty? • Respect confidentiality. Save data in a secure data folder.
ACT Data Inquiry – Get Started • Go to your data inquiry ACT question to start. • Follow the four steps.
Use the Fillable Form to Guidethe Data Inquiry Process Fillable Form • QUESTION • Enter your data question and select the data source • INVESTIGATE • Enter WISEdash. Navigate and apply filters to find the data picture that answers the data question. • CLARIFY • Document data findings. Fill in the areas indicated on the Fillable Form. • HYPOTHESIZE • Pose and categorize hypotheses of teacher and leadership practices related to the data findings.
Reflecting… • What did you learn through this Inquiry Process?
AP Dashboard Inquiry Finco & Torkelson
AP (Advanced Placement) Entry Points Students who pursue advanced college-levelcoursework through AP, IB, or dual enrollmentoptions signal that they have attained collegereadiness by virtue of their performance. APsubject test scores of three or higher (out of five)and IB subject area scores of five or higher (out of seven) often earn students college credit in those subject areas, and research indicates that scores in these ranges correspond with lower college-level remediation rates and higher college GPAs (International Baccalaureate Organization, 2010; Mattern, Shaw, & Xiong, 2009). Dual enrollment students who pass and earn credit for a college course typically keep the credits if they enroll in the host institution after high school. They may also be able to transfer the credits to another institution. From American Institutes of Research (AIR), April 2012 [betterhighschools.org]
AP Question Topics • Which questions are most important to explore?
About the AP Dashboard • Data is provided for the previous years (not current). • Note the six summary graphs for AP exam results. • Use the filters and related dashboards to view AP exam data for subgroups. • Note the default is “all subjects”. Use the filter to hone in on specifics. • View year-by-year trends.
About AP Scores • 5: Extremely Well Qualified • 4: Well Qualified • 3: Qualified • 2: Possibly Qualified • 1: No Recommendation Students who earn an AP score of 3 or above are generally considered to be qualified to receive college credit and/or placement into advanced courses equivalent to a college course score of middle C or above.
Thinking Ahead about“Drilling-Down” • Think ahead about AP detail investigationsthat are important. • Some helpful “drill-down” investigations when studying AP results? • What are the demographic characteristics of students who take the AP exams? Which students are not taking the exams? • Which exams show the highest passing rate? • Respect confidentiality. Save data in a secure data folder.
AP Data Inquiry – Get Started • Go to your data inquiry AP question to start. • Follow the four steps.
Use the Fillable Form to Guidethe Data Inquiry Process Fillable Form • QUESTION • Enter your data question and select the data source • INVESTIGATE • Enter WISEdash. Navigate and apply filters to find the data picture that answers the data question. • CLARIFY • Document data findings. Fill in the areas indicated on the Fillable Form. • HYPOTHESIZE • Pose and categorize hypotheses of teacher and leadership practices related to the data findings.
Reflecting… • What did you learn through this Inquiry Process?
Post-Secondary Dashboard Inquiry
Postsecondary Enrollment Inquiry Entry Points • Indicator of K-12 success in preparing for post-secondary education
Postsecondary Enrollment Question Topics • Which questions are most important to explore?
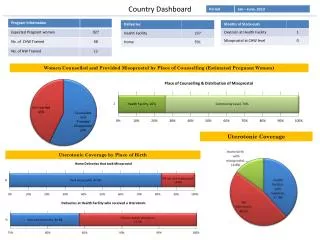
About the PostsecondaryEnrollment Dashboard • Data is provided for the previous years (not current). • Note the four summary graphs of postsecondary enrollment. • Use the filters data for subgroups. • Change the year filter to view year-by-year trends. • State data includes Students who enroll in a college course in high school.
Thinking Ahead about“Drilling-Down” • Think ahead about Postsecondary detail investigationsthat are important. • Some helpful “drill-down” investigations when studying postsecondary results … • What are the demographic characteristics of students who enroll in postsecondary programs? • Which students are not enrolling? • Which specific 2- and 4-year colleges are students most often enrolling? • When do students enroll? • Respect confidentiality. Save data in a secure data folder.
Postsecondary Data Inquiry – Get Started • Go to your data inquiry Postsecondary question to start. • Follow the four steps.
Use the Fillable Form to Guidethe Data Inquiry Process Fillable Form • QUESTION • Enter your data question and .select the data source • INVESTIGATE • Enter WISEdash. Navigate and apply filters to find the data picture that answers the data question. • CLARIFY • Document data findings. Fill in the areas indicated on the Fillable Form. • HYPOTHESIZE • Pose and categorize hypotheses of teacher and leadership practices related to the data findings.
Reflecting… • What did you learn through this Inquiry Process?
What? Now What? So What? Finco & Torkelson
Fillable Form on CESA 4 Website Finco & Torkelson
Share a WISE victory! Finco & Torkelson
Don’t Forget Your Exit Ticket! • We want and need your feedback!