Download
1 / 45
460 likes | 762 Vues
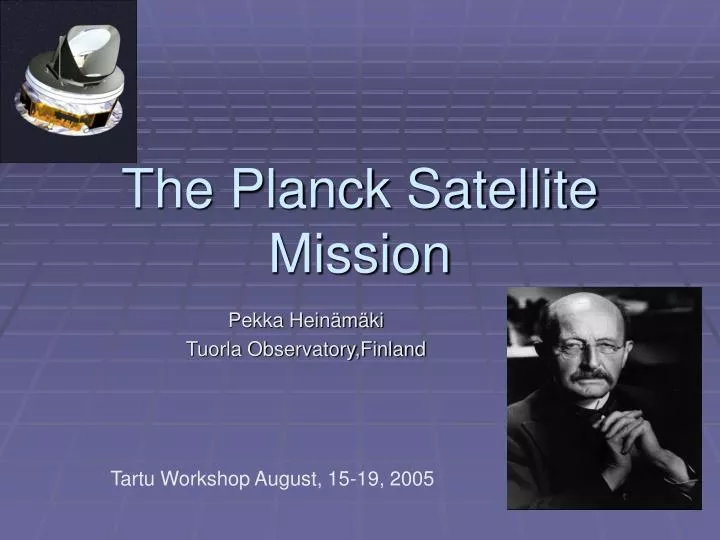
The Planck Satellite Mission. Pekka Heinämäki Tuorla Observatory,Finland. Tartu Workshop August, 15-19, 2005. Planck:The Cosmic Background Anisotropy Mission.

E N D
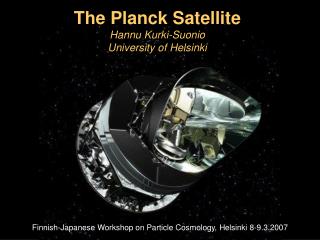
The Planck Satellite Mission Pekka Heinämäki Tuorla Observatory,Finland Tartu Workshop August, 15-19, 2005
Planck:The Cosmic Background Anisotropy Mission • Planck is a space observatory designed to image the temperature anisotopies of the CMB over the whole sky, with unprecedented sensitivity DT/T~2 x 10-6 and angular resolution < 10 ’ allow the determination of fundamental cosmological parameters with a few percent uncertainty - Mapping of Cosmic Microwave Background anisotropies with improved sensitivity and angular resolution - Testing inflationary models of the early universe - Measuring amplitude of structures in Cosmic Microwave Background
Mission Overview • Very wide frequency coverage • Extreme attention to suppression of systematic effects
Mission Overview • 1.5 m aperture Gregorian telescope with carbon fibry technology (Danish Consortium) • Field of view offset by ~ 85 degrees from spin-axies maitaind in antisun direction to cover full sky in half year
Guiana Space Centre, Kourou, French Guiana, in July 2007 by an Ariane-5 launcher. • together with ESA's Herschel spacecraft. • After a journey lasting between four and six months, Planck will make a major manoeuvre to enter its operational orbit, a small Lissajous orbit around L2, 1.5 millionkilometres away from the Earth.
The two vehicles will separate shortly after launch and proceed independently to different orbits about the second Lagrange point of the Earth-Sun system (L2).
Herschel (FIRST) • It will performe imaging photometry and spectroscopy in the far-Infrared and Submillimetre part of the spectra • HIFI (high resolution spectrographs), PACS (Photoconductor Array Camera and Specrometer), SPIRE (Spectral and Photometric Imaging Receiver) will cover the 60 – 670 micron waveband • Formation and evolution of galaxies and stars, ISM physics and chemistry, solar system bodies
World’s largest space mirror polished at Tuorla The mirror will be unique in many ways. When the mission is launched in 2007, it will be the largest ever sent to space. It will be the first SiC mirror used in a telescope, and of course the first to be used in space as well. It will be the first mirror polished to operate at both short radio wavelengths and long infra-red wavelengths. Herschel will be the first entirely European space telescope.
The High Frequency Instrument or HFI • 48 bolometers sensitive to 100-850 GHz (split into 6 channels) • Actively cooled to 0.1K • Best angular resolution ~ 5 ’ and temperature sensitivity ~5 microK
The High Frequency Instrument The High Frequency Instrument (HFI) is an array of 48 bolometric detectors which will be placed in the focal plane of the Planck telescope, and will image the sky in six frequency channels between 100 and 857 GHz. The HFI is being designed and built by a Consortium of scientists led by Jean-Loup Puget (PI) of the Institut d'Astrophysique Spatiale in Orsay (France), and Francois Bouchet (Deputy PI) of the Institut d'Astrophysique de Paris. The other main institutes involved in the HFI Consortium are: California Institute of Technology, in Pasadena (USA) Canadian Institute for Theoretical Astrophysics, in Toronto (Canada) Cardiff University, in Cardiff (UK) Centre d'Etudes Spatiales des Rayonnements, in Toulouse (F) Centre de Recherche sur les tres Basses Temperatures, in Grenoble (F) College de France, in Paris (F) Commissariat a l'Energie Atomique, in Gif-sur-Yvette (F) Danish Space Research Institute, in Copenhagen (DK) Imperial College, in London (UK) Institut d'Astrophysique de Paris, in Paris (F) Institut des Sciences Nucleaires, in Grenoble (F) Institute of Astronomy, in Cambridge (UK) - [Planck page ] Jet Propulsion Laboratory, in Pasadena (USA) Laboratoire de l'Accelerateur Lineaire, in Orsay (F) Laboratoire d'Etude du Rayonnement et de la Matiere en Astrophysique, in Paris, (F) Max-Planck-Institut fuer Astrophysik, in Garching (D) - [ Planck Page ] Mullard Radio Astronomy Observatory, in Cambridge (UK) National University of Ireland, in Maynooth (IR) Rutherford Appleton Laboratory, in Chilton (UK) Space Science Dpt of ESA, in Noordwijk (NL) Stanford University, in Stanford (USA) Universite de Geneve , in Geneva (CH) Universidad de Granada, in Granada (E) University La Sapienza, in Rome (I)
The Low Frequency Instrument or LFI • Consists of four arrays of 56 HEMT-based radio receivers, between 30 and 100 GHz • Operated at ~20K • Best angular resolution ~ 10 ’ and temperature sensitivity ~12 microK
The Low Frequency Instrument The Low Frequency Instrument (LFI) is an array of 56 tuned radio receivers which will be placed in the focal plane of the Planck telescope, and will image the sky in three frequency channels between 30 and 70 GHz. The LFI will be designed and built by a Consortium of scientists led by Reno Mandolesi of the Istituto Fisica Spaziale e Fisica Cosmica (IASF) in Bologna (Italy) - [Planck Page]. The other main institutes involved in the LFI Consortium are: Chalmers University of Technology, in Goteborg (S) Danish Space Research Institute , in Copenhagen (DK) -[ Planck Page ] Instituto de Astrofisica de Canarias, in La Laguna (E) Instituto de Fisica de Cantabria, in Santander (E) Istituto CAISMI, in Firenze (I) Istituto IASF (CNR), in Milano (I) Istituto di Fisica del Plasma IFP (CNR), in Milano (I) Istituto IFSI, in Roma (I) Jet Propulsion Laboratory , in Pasadena (USA) Max-Planck-Institut fuer Astrophysik , in Garching (D) - [ Planck Page ] Millimetre Wave Laboratory, in Espoo (FI) Jodrell Bank Observatory, in Macclesfield (UK) Osservatorio Astronomico di Padova, in Padova (I) Osservatorio Astronomico di Trieste, in Trieste (I) - [ LFI's DPC home page ] SISSA, in Trieste (I) Space Science Dpt of ESA , in Noordwijk (NL) Theoretical Astrophysics Center, in Copenhagen (DK) University of California (Berkeley), in Berkeley (USA) University of California (Santa Barbara), in Santa Barbara (USA) Universite de Geneve, in Geneva (CH) University of Oslo, in Oslo (N) Universita Tor Vergata, in Roma (I)
* Sensitivity (1 ) to intensity (Stokes I) fluctuations observed on the sky, in thermodynamic (x10-6) temperature units, relative to the average temperature of the CMB (2.73 K), achievable after two sky surveys (14 months).
Instrument noise etc. =TOD HEALPIX also "electric" and "magnetic" parts of the the polarization field To remove contaminating foreground signals Secondary anisotropies! Show how much T varies from to point to point on the sky Values of cosmological parameters can be determined by comparing model and observed temperature power spectra Maximize the ability to: discriminate between different cosmologial models, substract foregrounds & minimize the susceptibility to systematic errors: pointing strategy, frequency coveragy… http://space.mit.edu/home/tegmark/cmb/pipeline.html
A simulation of the CMB anisotropies at an angular resolution and sensitivity level typical of what can be achieved by Planck.
German Astrophysical Virtual Observatory • The Planck Simulator • The Planck Simulator provides synthetic sky maps of the Cosmic Microwave Background. The Planck Simulator allows to enter a variety of parameters which describe the assumed cosmology and allows to include a number of foreground emission processes. A detailed description of the available options can be found here. http://www.g-vo.org/portal/tile/products/services/planck/index.jsp
WOMBAT is dedicated to understanding sources of microwave foreground emission and providing the cosmology community with estimates of foreground emission as well as uncertainties in those estimates. http://astron.berkeley.edu/wombat/
Analysis Packages: HEALPix SpICE MADCAPMicrowaveAnisotropy Dataset ComputationalAnalysis Package CMBFitCMBfit is a software package for ultra-fast calculation of likelihoods from the Wilkinson Microwave Anisotropy Probe (WMAP) data GLESPGauss-Legendre Sky Pixelization for CMB analysis C(l) Computation: CMBFAST The CMBfast software can be used for the computation of the theoretical spectra of CMB anisotropy. The HEALPix synfast program reads in the output of this routine to allow one to generate random realisations of the observable CMB sky. CAMBCode for Anisotropies in the Microwave Background CMBEASYCMBEASY is a software package for calculating the evolution of density fluctuations in the universe DAShCMBEASY is a software package for calculating the evolution of density fluctuations in the universe RECFASTA code to calculate the recombination history of the Universe Hierarchical Equal Area isoLatitude Pixelisation of the sphere
Characterizing the microwave background sky • Cosmological information is encoded in the statistical properties of the maps, hot and cold spots • To find out how much anisotropy is there on different spatial scales -> a map of temperature fluctuations on a sphere conventionally described in terms of spherical harmonics. • IF fluctuations in the early Universe obey Gaussian statistics, as expected in most theories each of the coefficients alm is independent and so the power spectrum provides a complete statistical description of the temperature anisotropies
The shape of the angular power spectrum is very sensitively dependent on fundamental cosmological parameters • First peak (position) shows the universe is close to spatially flat =total energy density • First peak (hight) depends upon the matter and baryon density (both depend on the Hubble constant) • Constraints on the second peak indicate substantial amounts of dark baryons • Third peak will measure the physical density of the dark matter • Damping tail will provide consistency checks of underlying assumptions • curvature of the universe the position of the peaks • I<100 plateau indicate Scale-invariant density fluctuations, tilting the primordial power spectrum raising the right side relative to the left side (taken from W. Hu's web page)
Temperature (TT) results are consistent with ACBAR and CBI measurments • Cross-power spectrum (TE) adiapatic initial conditions, isocurvature models predict a dominat peak at l ~ 330 and subdominant peak at l ~ 110. • Defect models do not have multiple acoustic peaks no vector component
…And… Wb consistent with: abundance measurments Wm clusters dark matter estimates WD supernova data H0 HST Cepheid measurments • Concordance model (built up last few years using many different data sets) Inflation predicts:Universe is flat requires cosmological constant Inflation predicts: Gaussian fluctuations and scale-invariant scalar spectral index n_s~1 Baryon density and dark matter densities, Hubble constant are defined with 5% accurarcy BUT t/n_s degeneracy !
Precision cosmology • Planck has the ability : Detect much smaller temperature variations (about ten times WMAP) in the CMB than previous missions Perform CMB measurements with a higher angular resolution than ever before (about twice better than WMAP) Measure over a wider band of frequencies to enhance the separation of the CMB from interfering foreground signals (ifrequency coverage about ten times larger than WMAP) (taken from W. Hu's web page)
Hu's web page • The main difference between Planck and MAP lies in the quality of the CMB data taken, and therefore, in the accuracy with which the cosmological parameters can be determined + polarization properties
Polarization • Thomson scattering of temperature anisotropies on the last scattering surface generates a linear polarization pattern on the sky. Polarisation pattern can be separated into `electric' (E) and `magnetic' (B) components. USEFUL BECAUSE: • As polarization is generated only at last scattering, it probes last scattering in a more direct way than anisotropies alone • Observations of polarization provide an important tool for reconstructing the model of the fluctuations from the observed power spectrum breaking the degeneracy between certain parameter combinations • Different sources of temperature anisotropies (scalar, vector and tensor) give different patterns in the polarization: both in its intrinsic structure and in its correlation with the temperature fluctuations themselves. • Polarization power spectrum provides information complementary to the temperature power spectrum. This can be of use in breaking parameter degeneracies and thus constraining cosmological parameters more accurately. • Timing of reionization
Reionization The absence of a Lyman alpha abrorbtion trought in the spectra of high redshift quasars z > 6 shows that the intergalactic medium must have been reionoized BUT:The re-ionization could not have been earlier than z ~ 30, or there would be a suppression of the first Doppler peak in the angular fluctuation spectrum of the Cosmic Microwave Background (Tegmark & Zaldarriaga 2000; De Bernardis et al. 2000). WMAP led to the estimate tau ~0.17+-0.04.WMAP accuracy is not enough for discrimination between models (Naselsky, Chiang 2004). Double reionization models [Cen 2003, Wythe, Loeb 2003], period of extended reionization [Haiman, 2003], but more complex pictures are possible
Tau is only mildly constrained by Cl_t. WMAP ET-correlation spectrum and the E-polarization spectrum Cl_E contain independent information on tau. The majority of this information is conveyed by the spectral components with l<30. • Cosmic variance. • Large angles polarization data can be used to discriminate between different reionization histories. CMB (polarization) experiments will be indispensable for shedding light on those details of the reionization process that can be inspected through this observational window (Colombo 2004). http://background.uchicago.edu/~whu/polar/webversion/
Contraining inflation: Initial peturbations comprise a contribution from tensor modes (gravity waves) in addition to scalar modes (density peturbations) contribute on lasrge scales (r=T/S). Differentiating between tensor and scalar modes: Scalar perturbations produce a pure E-mode polarisation pattern Vector perturbations (generated in topological defect models) generate mainly a B-mode polarisation pattern Tensor modes (gravity wave) generate an admixture of E- and B-modes
The E-mode polarization greatly exceeds the B-mode then scalar fluctuations dominate the anisotropy. Conversely if the B-mode is greater than the E-mode, then vectors dominate. If tensors dominate, then the E and B are comparable.These statements are independent of the dynamics and underlying spectrum of the perturbations themselves http://background.uchicago.edu/~whu/polar/webversion/
Secondary effects Broad frequency coverage (from 30 to about 900 GHz) detailed nature of various astrophysical foregrounds -> must be corrected -> but also byproducts Cluster of galaxies: kSZ-effect and tSZ-effect Extragalactic sources Galactic studies: dust properties, magnetic field, distrb. Of the ionized vs. interstellar medium
1.In the low frequency channels ( 30 to 90 GHz), are expected to detect mainly radio-loud, flat-spectrum radiogalaxies and QSOs, blazars, and possibly some inverted-spectrum radiosources. 2. In the millimetre channels (90 to 300 GHz), the predominant extragalactic sources will be rich clusters of galaxies detected via the SZ effect. 3.In the sub-millimetre channels (300 to 900 Ghz), are expect to detect many thousands of infra-red luminous galaxies (both normal and starbursting) and (mostly radio-quiet) AGNs, and a few high-redshift galaxies and QSOs. 4. In sub-mm and mm wavelengths maps of the emission from Galactic
Sunyaev-Zeldovich Effect The thermal Sunyaev-Zeldovich effect arises from the frequency shift when CMB photons are scattered by the hot electrons in the intra-cluster gas. Observations of the SZ effect provide information on the hot intra-cluster gas that is complementary to that derived from observations at X-ray wavelengths The kinematic Sunyaev-Zeldovich effect: Peculiar velocities of the hot intra-cluster gas lead to a Doppler shift of the scattered photons which is proportional to the product of the radial peculiar velocity and the electron density integrated along the line of sight through the cluster -> possible to measure cluster peculiar velocities The frequency dependence of the TSZ distortion is characterised by three distinct frequencies 217 GHz, where TSZ vanishes; 150 GHz which gives the minimum decrement of the CMB intensity and 350 GHz which gives the maximum distortion.
3 deg The Thermal SZ effect High signal to noise and angular resolution are essential to studying higher order effects and cross-correlating CMB maps with observations at other wavelengths. Input SZ simulation WMAP 4yr Planck 1yr From Martin White talk:Constrainning Cosmology in the Planck Era
The SZ effect probes the intra-cluster gas temperature whereas the X-ray emission is more sensitive to the density distribution. From Planck-HFI page
Maps of the sum of primary CMB and secondary SZ anisotropies. YSZ is for the thermal SZ effect and KSZ is for the kinetic effect. The maps are obtained from hydrodynamical simulations of structure formation. The SZ effect anisotropies induce additional power at small angular scales. From Planck-HFI page
The combination of spatially resolved X-ray temperature and flux profiles, and measurements of the thermal SZ effect in the CMB, can be used to estimate the true spatial dimensions of rich clusters of galaxies and hence to estimate the Hubble constant • Observations of the SZ effect provide information on the hot intra-cluster gas that is complementary to that derived from observations at X-ray wavelengths • Rich cluster survay (~104 entries)
So… we need Planck and others.. If we know Hubble parameter to about 5% is it good enough? We still know nothing about Lamba and dark matter - most of the Universe How about Gaussianity? n_s=1 and Gaussianity do not distinguish between inflatoniary models (we have only upper limits on tensor to scalar ratio r=T/S) Timing of reionization ……
SPOrt is an Astrophysical Project aimed at observing the polarization of the sky in the microwave range 20-100 GHz, with angular resolution of 7°. Primary goals are: tentative detection of CMB Polarization on large angular scales maps of Galactic synchrotron emission at the lowest frequencies (22-32 GHz) SPOrt is carried on under the scientific responsibility of an International collaboration of Institutes headed by the IASF-CNR in Bologna and is fully funded by the Italian Space Agency (ASI).It has been selected by ESA to be flown on board the International Space Station (ISS) for a minimum lifetime of 18 months.
Suborbital Experiments • http://lambda.gsfc.nasa.gov/product/suborbit/su_experiments.cfm
Full name l- min l - max