Download
1 / 7
70 likes | 82 Vues
COUNTING OUTCOMES & THEORETICAL PROBABILITY. 12-4. TREE DIAGRAMS. You can use tree diagrams to display and count possible choices. This option of counting possible choices is used when the possibilities are limited. Example.

E N D
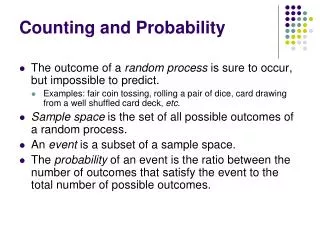
TREE DIAGRAMS • You can use tree diagrams to display and count possible choices. • This option of counting possible choices is used when the possibilities are limited.
Example • A school team sells caps in two colors (blue or white), two sizes (child or adult), and two fabrics (cotton or polyester). Draw a tree diagram to find the number of cap choices. When you use tree diagrams to decide how many choices there are, count up how many options you have in the right hand column. = 8 choices Cotton Polyester Cotton Polyester Cotton Polyester Cotton Polyester Child Adult Child Adult Blue White
COUNTING PRINCIPLE • Another way to count choices is to use the counting principle. • If there are m ways of making one choice, and n ways of making a second choice, then there are m(n) ways of making the first choice followed by the second. • This option is particularly useful when a tree diagram would be too large to draw.
Example • How many two-letter monograms are possible? • Since there are 26 letters in the alphabet, there would be: • First choice Second choice 26 choices 26 choices So, 26(26) = 676 possible monograms
Finding probability by counting outcomes • You can count outcomes to help you find the theoretical probability of an event in which outcomes are equally likely. • A sample space is a list of all possible outcomes. You can use a tree diagram to find a sample space. Then you can calculate probability.
Example • Use a tree diagram to find the sample space for tossing two coins. Then find the probability of tossing two tails. Heads Tails Heads Tails Answer: There are 4 possible outcomes, one of which is tossing two tails: 1/4 Heads Tails • You can also use the probability formula to solve this problem: • P(event) = # of favorable outcomes = 1 • # of possible outcomes 4