Download
1 / 38
380 likes | 497 Vues
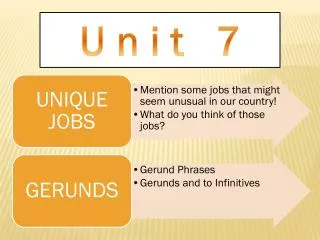
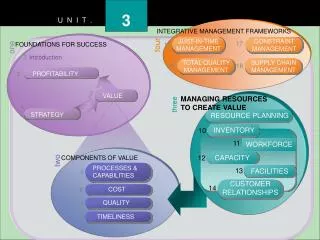
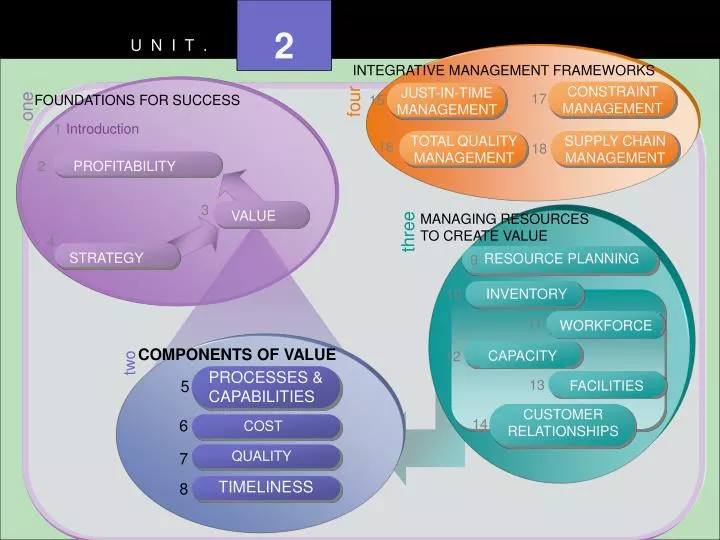
FOUNDATIONS FOR SUCCESS. one. Introduction. PROFITABILITY. VALUE. STRATEGY. RESOURCE PLANNING. WORKFORCE. CAPACITY. COMPONENTS OF VALUE. two. PROCESSES & CAPABILITIES. 5. INVENTORY. FACILITIES. CUSTOMER RELATIONSHIPS. 6. COST. QUALITY. 7. TIMELINESS. 8. SUPPLY CHAIN

E N D
FOUNDATIONS FOR SUCCESS one Introduction PROFITABILITY VALUE STRATEGY RESOURCE PLANNING WORKFORCE CAPACITY COMPONENTS OF VALUE two PROCESSES & CAPABILITIES 5 INVENTORY FACILITIES CUSTOMER RELATIONSHIPS 6 COST QUALITY 7 TIMELINESS 8 SUPPLY CHAIN MANAGEMENT JUST-IN-TIME MANAGEMENT CONSTRAINT MANAGEMENT TOTAL QUALITY MANAGEMENT 2 U N I T . INTEGRATIVE MANAGEMENT FRAMEWORKS 17 four 15 1 16 18 2 3 MANAGING RESOURCES TO CREATE VALUE three 4 9 10 11 12 13 14
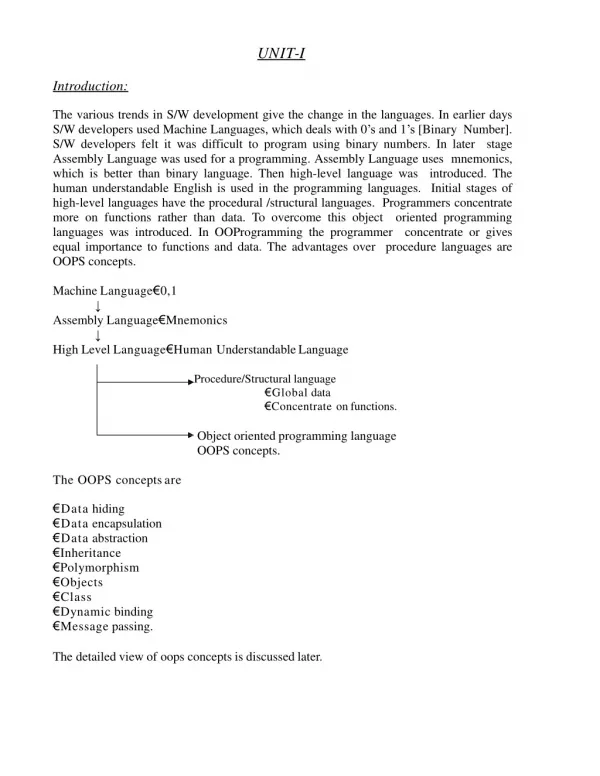
L E A R N I N G O B J E C T I V E S 7 C H A P T E R Quality • Define quality from a customer’s perspective. • Describe the relationships between quality and value as well as quality and profitability. • Compare proactive and reactive approaches to quality management. • Describe the costs of quality. • Explain the function of the general-purpose quality analysis tools. • Describe an make computations for process capability. • Describe how acceptance sampling works and the role of the operating characteristics curve. • Understand the Kano model. • Explain how six sigma quality relates to process capability. • Describe serve quality applications, including service blueprinting and moment-of-truth analysis. • Describe how “recovery” applies to quality failures.
Product and Service Quality Defined • Quality is defined by the customer. • Quality has a key role in customer perception of value. Exhibit 7.1 The Role of Quality in The Resource/ Profit Model
Dimensions of Quality • Dimensions of product quality
Dimensions of Quality • Dimensions of Service Quality
Service and Quality Dimensions Combined Exhibit 7.4 Dimensions of Service and Product Quality Combined Reel Operations 7.1
Proactive versus Reactive Quality Management • Prevention of defects reduces costs. Reel Operations 7.2
Cost of Quality • All of the costs associated with maintaining the quality of goods and services. • External failure costs (including recovery costs). • Internal failure costs • Appraisal costs (inspection and testing) • Prevention costs Exhibit 7.5 Cost of Quality as a Company Moves from External Failures toward Prevention
Quality Tools • Flowcharts Exhibit 7.6 Flowchart
Quality Tools • Run Charts Exhibit 7.7 Run Chart
Quality Tools • Cause and Effect Diagrams Exhibit 7.8 Cause and Effect Diagram
Quality Tools • Pareto Charts Exhibit 7.9 Pareto Chart
Example 7.1 Pareto Analysis • Complete a Pareto analysis on the following data.
Example 7.1 Pareto Analysis • Solution Excel Tutor 7.1
Example 7.1 Pareto Analysis • Solution (continued) Exhibit 7.12 Pareto Chart for Complaints by Room Area
Example 7.1 Pareto Analysis • Solution (continued) Exhibit 7.13 Pareto Chart for Complaints by Type
Quality Tools • Check Sheets Exhibit 7.15 Check Sheet
Quality Tools • Scatter Diagrams Exhibit 7.16 Scatter Diagram
Quality Tools • Control Charts • Distinguishing between random fluctuation and fluctuation due to an assignable cause. • X-bar chart • Upper and lower control limits. Exhibit 7.17 Process Control Chart Data Gathering Process Reel Operations 7.3
Statistical Process Control Exhibit 7.18 Process Control Chart for Soft Drink Can
Statistical Process Control • Capability Index: quantifying the relationship between control limits and customer specifications • Cp and Cpk Interactive Model 1.2
Example 7.2 Capability Index Calculation • Customer specification: .375 + or – 0.002 • NTRU process mean is .375 with a standard deviation of .0024 • Is the NTRU process capable of meeting customer’s specifications? • Solution: • Cp = 0.377 – 0.373 = 0.27778 6(0.0024) • No, the process is not capable of meeting customer specifications Excel Tutor 7.2
Statistical Process Control • Cpk Capability Index • For shifting process means Exhibit 7.19 Process Shifted Downward From Center
Example 7.3: Cpk Calculation • Customer specification: .375 + or - .002 • Standard deviation of process at 0.0003 • Customer specification limits at .373 and .377 • Solution: Cpk = min[ 0.376 – 0.373 , 0.377 – 0.376 ] 0.0009 0.0009 = min [3.333, 1.111] = 1.111 The process is still capable. Excel Tutor 7.3
R-charts • Provide monitoring of variability within the sample. • Always paired with X-bar charts. Interactive Model 7.1
Example 7.4 X-bar and R-chart Construction • Using the data in Exhibit 7.21, construct X-bar and R-charts.
Example 7.4 X-bar and R-chart Construction • Solution: • = - UCL = X + A2R = 1,000 + (0.577)(8.8) = 1,005.078 = - LCL = X - A2R = 1,000 - (0.577)(8.8) = 994.9224
Example 7.4 X-bar and R-chart Construction • Solution: Exhibit 7.22 X-bar Chart for Example 7.3
Example 7.4 X-bar and R-chart Construction • R-chart control limits _ UCL = D4 R = 2.114 (8.8) = 18.6032 _ LCL = D3 R = 0(8.8) = 0
Example 7.4 X-bar and R-chart Construction Exhibit 7.23 R-Chart for Example 7.3 Excel Tutor 7.4
Acceptance Sampling • Acceptable Quality Level (AQL) • Lot tolerance percent defective (LTPD) • Producer’s risk • Consumer’s risk • Operating Characteristics Curve Exhibit 7.25 Operating Characteristics Curve
Moving Beyond Customer Satisfaction • The Kano Model • Six Sigma Quality Exhibit 7.26 Process Capability for Three Sigma Quality
Six Sigma Quality Exhibit 7.27 Process Capability for Six Sigma Quality
Service-oriented Quality Improvement • Service Blueprinting • Moment-of-Truth Analysis • Enhancers, standard expectations, detractors. • Customer Relationship Management
Service Blueprinting • Fail Points • Wait Points • Line of Visibility Exhibit 7.28 Service Blueprint of Oil Change Service
Recovery • A plan to save a customer from defecting when a failure takes place.
Total Quality Management • A culture of doing it right the first time. • Includes internal and external customers.