Download
1 / 36
360 likes | 523 Vues
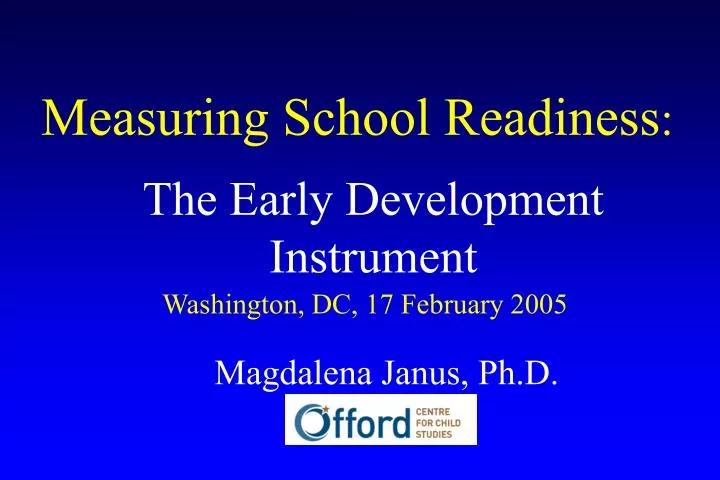
Measuring School Readiness :. The Early Development Instrument. Washington, DC, 17 February 2005. Magdalena Janus, Ph.D. Early years matter:. They set the stage for further development. Continuation of differences. Hypothetical growth trajectories. Simple continuation of differences.

E N D
Measuring School Readiness: The Early Development Instrument Washington, DC, 17 February 2005 Magdalena Janus, Ph.D.
Early years matter: They set the stage for further development
Continuation of differences Hypothetical growth trajectories Simple continuation of differences Increasing differences
Target for interventions Hypothetical growth trajectories School-based interventions Desired results
Target for interventions Hypothetical growth trajectories School-based interventions Frequently-achieved results
Target for interventions Hypothetical growth trajectories Pre-school-based interventions Desired results
Readiness to learn concept Children are born ready to learn: the neurosystem is pre-programmed to develop various skills and neuropathways, depending on the experience it receives.
All children are born ready to learn • Early development: speed, plasticity, non-linearity, vulnerability • Children are active participants • Interplay between genes and environment • Importance of early interaction and stimulation
Readiness for school Refers to the child’s ability to meet the task demands of school, such as: • being comfortable exploring and asking questions, • listening to the teacher, • playing and working with other children, • remembering and following rules. In short, it is the ability to benefit from the educational activities that are provided by the school.
Domains of school readiness • Physical health and well-being • Social competence • Emotional maturity • Language and cognitive development • Communication skills and general knowledge
Early Development Instrument (EDI) • Teacher-completed • 104 questions grouped into the five domains • Indicators of special problems and special skills • Up to 10 questions about the child’s pre-school experience
Purposes of the EDI • Report on populations of children in different communities • Monitor populations of children over time • Predict how children will do in elementary school
Physical Health and Well-being SUBSCALES • Physical readiness for school day • Physical independence • Gross and fine motor skills
Social Competence SUBSCALES • Overall social competence • Responsibility and respect • Approaches to learning • Readiness to explore new things
Emotional Maturity SUBSCALES • Pro-social behaviour and helping behaviour • Anxious and fearful behaviour • Aggressive behaviour • Hyperactivity and inattention
Language and Cognitive Development SUBSCALES • Basic literacy • Interest in literacy/numeracy and memory • Advanced literacy • Basic numeracy
Communication Skills and General Knowledge (No subscales) Ability to clearly communicate one’s own needs and understand others • Clear articulation • Active participation in story-telling (not necessarily with good grammar and syntax) • Interest in general knowledge about the world
Can school readiness serve as an indicator of children’s health in a community? • Concept of health • Population level indicator • Usefulness
Data collected from the whole population, or a representative sample Method relevant to the issue(s) in question Feasibility and ease of use (timing, respondents) Suitable for policy recommendations YES YES YES YES Population-level indicator
Some Canadian data on the EDI • Children who score low in one or more of the five domains of the EDI • “Low” - in the lowest 10 percent of the population within their site • Specific for domain • Specific for site • Norms available for comparison
Readiness to Learn at School by Family Income (N=1799) % 32.8 28.9 23.3 17.3 Source: NLSCY/UEY 1999/2000; EDI 1999/2000
Number of children “Not ready” 194 104 59 45 Source: NLSCY/UEY 1999/2000; EDI 1999/2000
School readiness and Grade 3 by neighbourhood affluence % below standard in Grade 3 in:
School readiness and neighbourhood affluence % % vulnerable in kindergarten
Contribution of EDI and SES to Grade 3 scores Neighbourhood level EDI SES variables Reading 8%* 10%* Writing 7%* 8%* Math 5% 12%* Source: Janus, Harren, Duku 2004 * p<.05
EDI and breastfeeding: neighbourhood • 21 Neighbourhoods in a Southern Ontario community • Data: % Low Birth Weights; % mothers breastfeeding at discharge from hospital; % Low on the EDI • Correlations: % Low EDI with % breastfeeding: -0.60 % Low BW with % breastfeeding: -0.54
EDI and birth weights - individual • Birth weight: Low and Normal • Timing of birth: Early and Normal • Normal BW, Normal TB least likely to have low EDI scores • Low BW, Early TB and Low BW, Normal TB most likely to have lowest scores
Can the EDI be adapted? • Used in three other countries with minimal changes • Subscale identification allows for valid shortening • Some room for adjusting items to ensure relevance to local context
Steps leading to the brief EDI • Selection of 3 items per subscales: 3 with highest loadings in the normative sample • Reliability of thus shortened scales in comparison with original EDI • Used the same 3 items for checking “short/long” reliability with Australian and US samples • Further reliability testing
Tasks required • Testing short form (can be done as a pilot work) • Local expert validation of the items selected for short EDI - local educators, academics • Confirmatory factor analyses
Reliability results - 1 • Operational definition of “not ready”: within lowest 10th percentile on 1 or more scales • Overlap of populations scoring as ready or not ready: • Ready: 92.9% (89.4% if 2 items) • Not ready: 92.3% (93.7% if 2 items)
Reliability results - 2 • More stringent operational definition of “not ready”: within lowest 10th percentile on 2 or more scales • Overlap of populations scoring as ready or not ready: • Ready: 88.6% (89.0% if 2 items) • Not ready: 97.3% (96.0% if 2 items)
Reliability results - 3 • Multiple Challenge Index: a child scoring below a specified level on at least 9 of 16 subscales (based on the original EDI) • 100% of children with MCI fall in the lowest 10th percentile on 1 or more scales • 98.9% of children with MCI fall in the lowest 10th percentile on 2 or more scales
Validity results - 4 • Association with other tests Correlations with PPVT: EDI short EDI Lang-Cognitive .344 .311 Communication .477 .418
Validity results - 5 Correlations with First Steps assessment: • Physical Health and Well-being 0.54 0.53 with FS Motor score • Social Competence 0.65 0.62 • Emotional Maturity 0.73 0.70 with FS Socio-emotional score • Language and Cognitive Development 0.58 0.56 • Communication Skills and General 0.52 0.53 Knowledge with FS Cognitive score EDI Short EDI N=68-94, all p<0.001