Download
1 / 15
240 likes | 847 Vues
Causal Comparative Research: Purpose. Attempts to determine cause and effect not as powerful as experimental designs Alleged cause and effect have already occurred and are being examined after the fact (e.g., ex post facto)

E N D
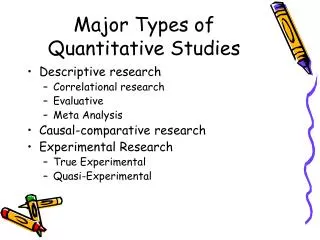
Causal Comparative Research: Purpose • Attempts to determine cause and effect • not as powerful as experimental designs • Alleged cause and effect have already occurred and are being examined after the fact (e.g., ex post facto) • Used when independent variables cannot or should not be examined using controlled experiments • A common design in educational research studies
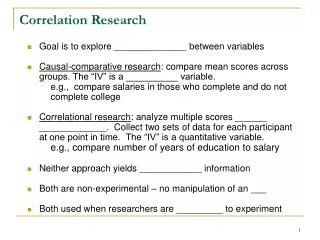
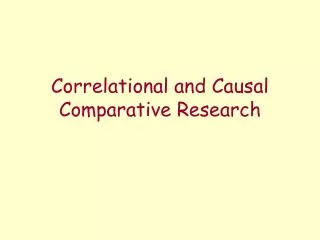
Similarities to Correlational Research • Both lack manipulation • Both require caution in interpreting results • Causation is difficult to infer • Both can support subsequent experimental research • Results can lead to testable experimental hypotheses
Correlational No attempt to understand cause and effect Two or more variables One group Causal comparative Attempts to understand cause and effect At least one independent variable Two or more groups Differences with Correlational Research
Example TopicThe Relationship between Years of Experience & Job Satisfaction • Correlational Design • Hypotheses: • Alternative - There a relationship between years of experience and job satisfaction among elementary school teachers. • Null - There is no relationship between years of experience and job satisfaction among elementary school teachers • Sample • One group (teachers) are randomly sampled • Variables • Years of experience • Job satisfaction • Both variables measured in all subjects
Example TopicThe Relationship between Years of Experience & Job Satisfaction • Correlational Design (cont.) • Data Analysis • Correlation computed between the two variables (r) within the group to test null hypothesis • Rejection of null hypothesis suggests that a years of experience is related to job satisfaction. Direction and magnitude of (r) determine nature of relationship
Example TopicThe Relationship between Years of Experience & Job Satisfaction • Causal Comparative Design • Hypotheses • Alternative - Teachers with a high level of experience will be more satisfied with their jobs than teachers with low levels of experience. • Null - Teachers with a high level of experience will be equally satisfied with their jobs when compared to teachers with low levels of experience. • Variables • Dependent - Job satisfaction • Independent - Years of experience • Two levels (high & low) • Exists naturally in the population of teachers at the start of study
Example TopicThe Relationship between Years of Experience & Job Satisfaction • Causal Comparative Design (cont.) • Sample • Two groups sampled, one for each level of the independent variable • High experience • Low Experience • Data Analysis • Mean job satisfaction ratings for High Experience & Low Experience subjects are compared using t-test, ANOVA, or other appropriate statistical test • Rejection of the null hypothesis supports the alternative hypothesis that years of experience results in increased job satisfaction
Experimental Causal group comparisons Individuals randomly assigned to treatment groups Independent variable manipulated by the researcher Causal comparative Group comparisons Individuals already in groups before research begins Independent variable not manipulated Cannot Should not Is not Comparison to Experimental Research
Examples of Naturally Occurring Variables • Non-manipulated variables • Age • Sex • Ethnicity • Learning style • Socioeconomic status • Parental educational level • Family environment • Preschool attendance • Type of school
Design and Procedures • Select two groups that differ on some independent variable • One group possesses some characteristic that the other does not • Each group possesses the characteristic but in differing amounts • The independent variable must be clearly operationally defined
Design and Procedures • Randomly sample subjects from each of the two groups • Collect background information on subjects to determine the equality of the groups • Compare groups on the dependent variable
Control of Extraneous Variables • Extraneous variables represent alternative explanations for research findings • These are variables that have not been ruled-out (controlled for) by a study’s design • In our previous example, what other variable besides years of experience could explain job satisfaction among teachers? • Class Size?
Control of Extraneous Variables • Lack of randomization, manipulation, and control are all weaknesses of causal comparative designs • Control procedures (lets consider how to control for class size in our previous example) • Matching • Each subject in the high experience group is matched with a subject in the low experience group along the variable of class size • Each high experience teacher who teaches a large class is matched with a low experience teacher who teaches a large class. • Each high experience teacher who teaches a small class is matched with a low experience teacher who teaches a small class
Control of Extraneous Variables • Control Procedures (cont.) • Comparing homogeneous groups • Subjects may only participate if they have large class sizes • Comparing subgroups • Statistically compare subjects with small & large class sizes to determine if the dependent variable is different between these subgroups • Analysis of covariance
Descriptive statistics Central tendency Mean Median Mode Variation Standard deviation Inferential statistics t-test Analysis of variance Analysis of covariance Chi-square Data Analysis