Download
1 / 9

E N D
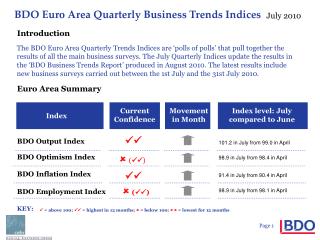
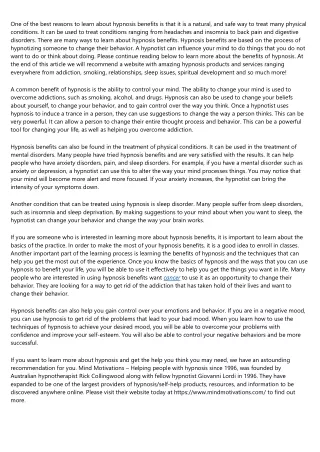
Introduction The BDO Monthly Trends Indices are ‘polls of polls’ that pull together the results of all the main business surveys. The May Monthly Indices update the results in the ‘BDO Business Trends Report’ produced in May 2010. The latest results include new business surveys carried out between the 1st May and the 31st May 2010. Summary and key findings Current Confidence Movement in Month Index level: March compared to February Index BDO Output Index 101.0 in May from 102.8 in April BDO Optimism Index 97.0 in May from 103.3 in April BDO Inflation Index 100.3 in May from 98.6 in April BDO Employment Index 90.5 in May from 92.0 in April KEY: = above 100; = highest in 12 months; = below 100;= lowest for 12 months
Commentary This month’s data reveal two key themes. Firstly, the BDO employment index supports the view of a weak labour market in the short term. With the index slipping back to levels last seen in June 2009 there may be some way top go before the labour market shows signs of improvement. There is significant slack in the labour market with unemployment rising on the internationally comparable ILO measure. In addition, with slack in the labour market as a result of firms not cutting employment by as much as output during the recession, firms able to service initial increases in demand with those already employed. Secondly, the optimism index (i.e. the index capturing business sentiment and giving a steer on output growth over the next two quarters) has swung downwards by 6.3 points, to reach 97.0 in May from 103.3 in April. This is the largest swing on record. This suggests that over the last month the outlook for growth in the second half of 2010 has weakened, as the eurozone crisis has hit the global economy and the scale of the public sector cuts has become clearer.
Despite a fall, the BDO Output Index remains above the 100 mark BDO Output Index, 100 = average trend growth The BDO output index showed a fall to 101.0 in May from 102.8 in April. This is the third month in a row that the index has been above 100, suggesting above trend growth. While growth is expected to be above trend over the next quarter, the outlook has deteriorated from last month. The fiscal squeeze in the United Kingdom and the eurozone (our largest trading partner) means demand is likely to cool over the coming months. Source: PMI, Bank of England, CBI and the Office for National Statistics
Optimism has slipped in the face of public sector cuts BDO Optimism Index, 100 = average trend growth • The BDO optimism index is set up to predict annual output growth two quarters ahead. • The BDO optimism index suggests that the pace of growth may weaken over the coming months. The index fell to 97.0 in May from 103.3 in April. • The current reading is consistent with annual output growth slightly below long term trend levels in the second half of this year. • This may be a reflection of the recent fiscal austerity measures and anticipation of greater public sector cuts in the emergency budget on the 22nd of June. While the private sector recovery seems to be gaining traction, the public sector will be a drag on economic growth once these cuts are implemented. Source: PMI, Bank of England, CBI and the Office for National Statistics
Inflation index suggests return to long run trend level BDO Inflation Index, 100 = average trend growth The BDO inflation index edged up in May to 100.3 from 98.6 in April. The current level is consistent with inflation around the long term trend rate. The official statistics showed that the annual rate of inflation in the United Kingdom was 3.7% in April, up from 3.4% in March. The annual change in consumer prices has been above or equal to the Bank of England’s target rate of 2.0% +/- 1% for the whole of 2010. The BDO inflation index suggests that inflation may begin to fall back to long term trend levels over the coming months. Source: PMI, Bank of England, CBI and the Office for National Statistics
Employment index remains weak as firms utilise spare capacity BDO Employment Index, 100 = average trend growth The BDO Employment index shows little evidence of the recovery feeding through into higher employment. The ILO unemployment measure of unemployment increased by 53,000 to 2.5 million over the three months to March, increasing the unemployment rate to 8.0 per cent from 7.8 per cent in the three months to December. Total employment continued to decrease, 76,000 lower in the three months to March compared to the previous quarter. The BDO Employment Index does not suggest that a improvement in the labour market is likely in the short term. Source: PMI, Bank of England, CBI and the Office for National Statistics
For further details Peter Hemington: BDO LLP, 55 Baker Street, London W1M 1DA Telephone: 020 7486 5888 Fax: 020 7487 3686 E-mail peter.hemington@bdo.co.uk Douglas McWilliams or Owen James: the centre for economics and business research ltd, Unit 1, 4 Bath Street, London EC1V 9DX Telephone: 020 7324 2850 Fax: 020 7324 2855 E-mail dmcwilliams@cebr.com or ojames@cebr.com
Methodological Notes The BDO Monthly Business Trends Indices are prepared on behalf of BDO LLP by the centre for economics and business research ltd., a leading independent economics consultancy. cebr has particular strengths in all forms of macroeconomic and market forecasting for the UK and European economies and in the use of business survey techniques. The indices are calculated by taking a weighted average of the results of the UK’s main business surveys. It incorporates the results of the quarterly CBI Industrial Trends Survey (and the CBI Monthly Trends Enquiry which is carried out in the intervening months); the Bank of England Agents’ summary of business conditions; and the Chartered Institute of Purchasing and Supply’s Surveys of Manufacturing and of Services. Taken together the surveys cover over 11,000 different respondents from companies employing approximately five million employees. The respondents cover a range of different industries and a range of different business functions. Together they make up the most representative measure of business trends available. The surveys are weighted together by a three-stage process. First, the results of each individual survey are correlated against the relevant economic cycles for manufacturing and services. This determines the extent of the correlations between each set of survey results and the relevant timing relationships. Then the surveys are weighted together based on their scaling, on the extent of these correlations and the timing of their relationships with the relevant reference cycles. Finally, the weighted total is scaled into an index with 100 as the mean, the average of the past two cyclical peaks as 110 and the average of the past two cyclical troughs as 90. The results can not only be used as indicators of turning points in the economy but also, because of their method of construction, be seen as leading indicators of the rates of inflation and growth.