Download
1 / 9
90 likes | 181 Vues
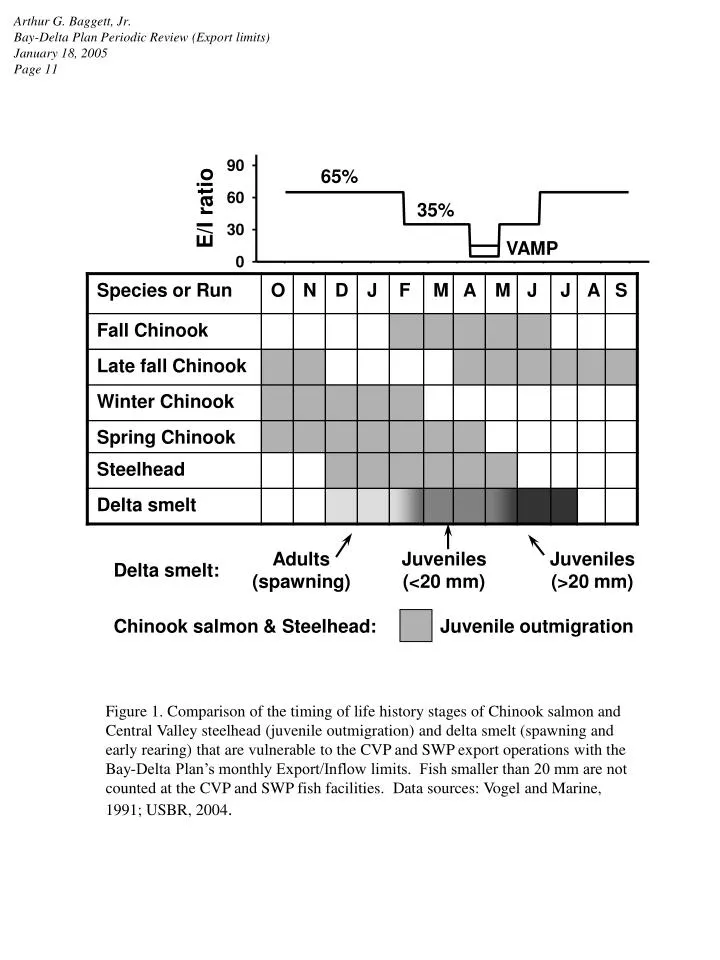
Arthur G. Baggett, Jr. Bay-Delta Plan Periodic Review (Export limits) January 18, 2005 Page 11. 65%. 35%. VAMP. Adults (spawning). Juveniles (<20 mm). Juveniles (>20 mm). Delta smelt:. Chinook salmon & Steelhead:. Juvenile outmigration.

E N D
Arthur G. Baggett, Jr. Bay-Delta Plan Periodic Review (Export limits) January 18, 2005 Page 11 65% 35% VAMP Adults (spawning) Juveniles (<20 mm) Juveniles (>20 mm) Delta smelt: Chinook salmon & Steelhead: Juvenile outmigration Figure 1. Comparison of the timing of life history stages of Chinook salmon and Central Valley steelhead (juvenile outmigration) and delta smelt (spawning and early rearing) that are vulnerable to the CVP and SWP export operations with the Bay-Delta Plan’s monthly Export/Inflow limits. Fish smaller than 20 mm are not counted at the CVP and SWP fish facilities. Data sources: Vogel and Marine, 1991; USBR, 2004.
Arthur G. Baggett, Jr. Bay-Delta Plan Periodic Review (Export limits) January 18, 2005 Page 12 Figure 2. Unimpaired runoff from the San Joaquin basin compared to actual flow in the lower San Joaquin River (Vernalis) and Delta exports. Unimpaired runoff is calculated as the sum of unimpaired runoff from the Stanislaus, Tuolumne, Merced and San Joaquin Rivers reported by the California Data Exchange Center (CDEC). Vernalis flows and exports (calculated as the sum of CVP and SWP exports) are from Dayflow (California Department of Water Resources). Upstream water management operations have drastically reduced flow in the lower San Joaquin River year-round. Except during the April 15-May 15 VAMP, Delta exports consistently exceed Vernalis flows by two- to seven-fold. The green box highlights the ecological sensitive spring period when many fish species are rearing and migrating through the Delta.
Arthur G. Baggett, Jr. Bay-Delta Plan Periodic Review (Export limits) January 18, 2005 Page 13 Figure 3. The ratio between San Joaquin River flow (Vernalis, 3-day running average, cfs) and combined exports (CVP + SWP, cfs) during the April 15-May 15 “VAMP” period, 1969-2003. Since the 1996, when the the delta smelt biological opinion, Bay-Delta Plan, and the VAMP were implemented, the ratio has been consistently greater than 2.0 (i.e., 2:1 San Joaquin River:Exports) even in drier years. Data sources: California Department of Water Resources, Dayflow.
Arthur G. Baggett, Jr. Bay-Delta Plan Periodic Review (Export limits) January 18, 2005 Page 14 March 15-April 14 May 16-June 15 April 15-May 15 (VAMP) Figure 4. The ratio between San Joaquin River flow (Vernalis, 3-day running average, cfs) and combined exports (CVP + SWP, cfs) during the April 15-May 15 “VAMP” period (green line), the one-month period before VAMP (March 15-April 14, open blue circles), and the one-month period after VAMP (May 16-June 15, closed red circles), 1969-2003. While the flow ratio during the VAMP period has improved substantially, flows immediately before and after the 31-day period remain critically low. Data sources: California Department of Water Resources, Dayflow.
Arthur G. Baggett, Jr. Bay-Delta Plan Periodic Review (Export limits) January 18, 2005 Page 15 Figure 5. Results for the California Department of Fish and Game 20 mm survey, which samples larval and small juvenile fishes, conducted April 207, 2002. The plot shows presence and abundance of larval delta smelt (green circles). The small graph inset in the top left corner shows the size distribution of the fish collected. In early April of 2002, two weeks before the VAMP export reduction and San Joaquin River flow increase, young delta smelt were concentrated in the southern and central Delta. Particle tracking modeling indicates that virtually all of these fish would likely be entrained at the CVP and SWP export facilities.
Arthur G. Baggett, Jr. Bay-Delta Plan Periodic Review (Export limits) January 18, 2005 Page 16 Delta smelt abundance Exports Figure 6. Comparison of population abundance of juvenile delta smelt measured by CDFG Summer Townet survey (black line and symbols) with March-May exports (acre-feet, blue line and symbols). The decline in the delta smelt population during the 1980s, as well as decline during the most recent several years, corresponds with increases in exports during the early rearing period (March-April, see Figure 1). At this time of the year, most juvenile delta smelt are smaller than 20 mm in length and therefore most fish entrained into the fish facilities are not salvaged or counted. Source: K. Fleming, California Department of Fish and Game, presentation at the 2004 Environmental Water Account Science Review.
Arthur G. Baggett, Jr. Bay-Delta Plan Periodic Review (Export limits) January 18, 2005 Page 17 Figure 7. The Return Ratio of San Joaquin basin fall-run Chinook salmon plotted against the average March-June San Joaquin River (SJR) flow to export ratio. Return ratios below 1.0 indicate declining salmon populations; return ratios greater than 1.0 indicate increasing salmon populations. In 95% of years in which the SJR:Exports ratio was greater than 1.0, the return ratio for San Joaquin Chinook salmon was greater than 1.0. In 63% of years in which the SJR:Exports ratio was less than 1.0, San Joaquin salmon populations declined. Data sources: California Department of Fish and Game, “Grandtab”; California Department of Water Resources, Dayflow.
Arthur G. Baggett, Jr. Bay-Delta Plan Periodic Review (Export limits) January 18, 2005 Page 18 Figure 8. Hypothetical hydrograph showing Delta inflow (black line) and maximum exports as limited by a 65% E/I ratio (and maximum allowed pumping capacity) calculated using the inflow metric as the 3-day running average (solid red circles) and as the 14-day running average (open blue circles). During the ascending limb of the hydrograph, greater exports are allowed if inflows is calculated using the 3-day average. As flows decline, greater exports are allowed if inflows are calculated using the 14-day average.
Arthur G. Baggett, Jr. Bay-Delta Plan Periodic Review (Export limits) January 18, 2005 Page 19 Figure 9. Average monthly loss of juvenile Chinook salmon and delta smelt at the CVP and SWP export facilities. High losses of Chinook salmon during the spring (April-June) reflect the much larger population size of fall-run Chinook salmon compared to the other three runs. For delta smelt, fish lost during the winter months (December-March) are predominantly adults and fish lost later in the year are juveniles. Large numbers of larval and juvenile delta smelt (<20 mm in length) are entrained and lost during the early spring (March-April) but these smaller fish are not salvaged or counted. Chinook salmon data provided by D. Odenweller; delta smelt data are from California Department of Fish and Game.