Download
1 / 1
10 likes | 76 Vues
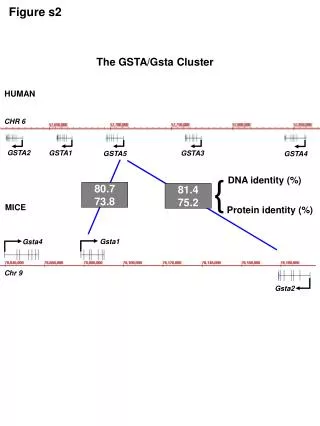
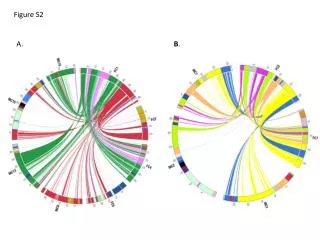
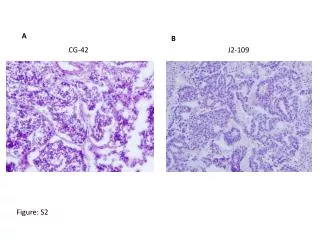
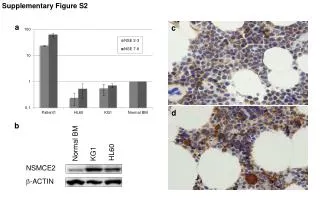
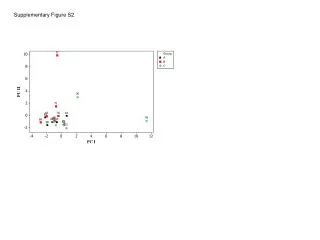
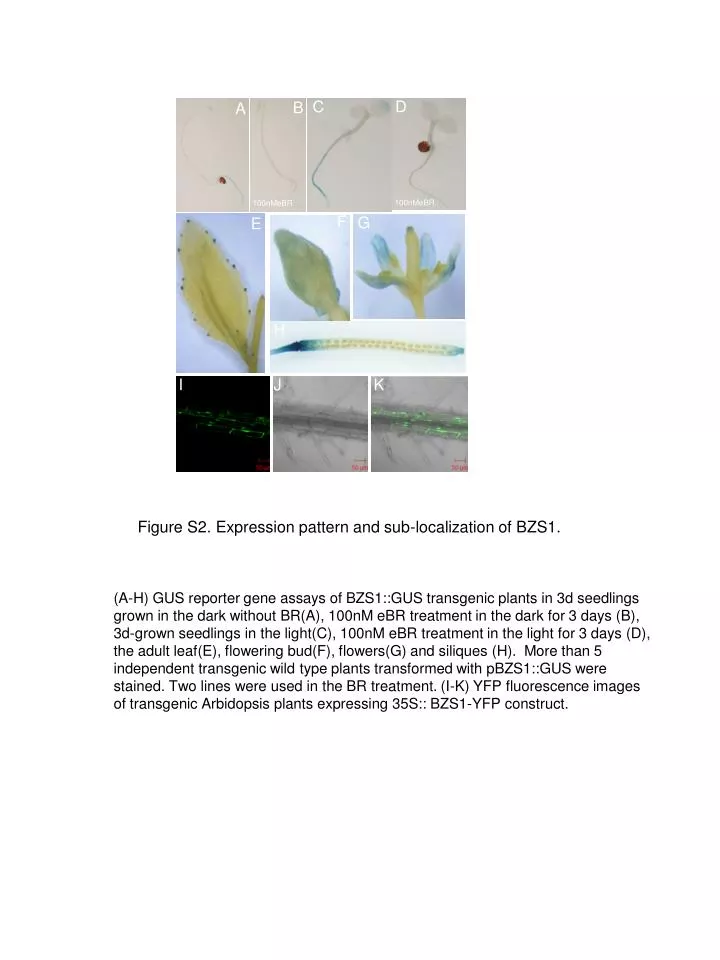
A. C. A. B. B. C. D. D. B. C. A. D. 10nMeBR. E. F. G. 100nMeBR. 100nMeBR. F. E. G. H. H. I. J. K. Figure S2. Expression pattern and sub-localization of BZS1. .

E N D
A C A B B C D D B C A D 10nMeBR E F G 100nMeBR 100nMeBR F E G H H I J K Figure S2. Expression pattern and sub-localization of BZS1. (A-H) GUS reporter gene assays of BZS1::GUS transgenic plants in 3d seedlings grown in the dark without BR(A), 100nM eBR treatment in the dark for 3 days (B), 3d-grown seedlings in the light(C), 100nM eBR treatment in the light for 3 days (D), the adult leaf(E), flowering bud(F), flowers(G) and siliques (H). More than 5 independent transgenic wild type plants transformed with pBZS1::GUS were stained. Two lines were used in the BR treatment. (I-K) YFP fluorescence images of transgenic Arbidopsis plants expressing 35S:: BZS1-YFP construct.