Download
1 / 38
380 likes | 519 Vues
Studying mortality trends: The IMPACT CHD Policy Model. Prof Simon Capewell Chair of Clinical Epidemiology DIVISION OF PUBLIC HEALTH LIVERPOOL UNIVERSITY UK 14 th January 2008 Particular thanks to: Julia Critchley, Kath Bennett Martin O’Flaherty, Robin Ireland, Ann Capewell.

E N D
Studying mortality trends:The IMPACT CHD Policy Model Prof Simon Capewell Chair of Clinical Epidemiology DIVISION OF PUBLIC HEALTH LIVERPOOL UNIVERSITY UK 14th January 2008 Particular thanks to:Julia Critchley, Kath Bennett Martin O’Flaherty, Robin Ireland, Ann Capewell Charity No: 1110067
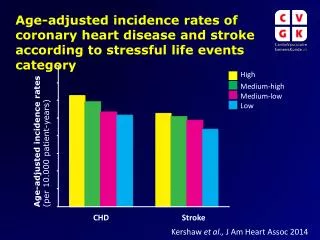
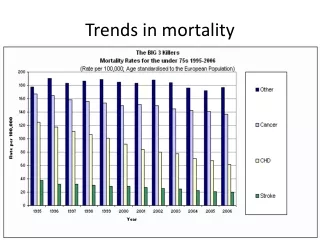
International mortality trends1968-2003men, coronary heart disease [CHD] Source:BHF Heartstats (WHO statistics Men aged 35 - 74, Standardised)
International mortality trends1968-2003men, coronary heart disease [CHD] Why have CHD mortality rates halved? Source:BHF Heartstats (WHO statistics Men aged 35 - 74, Standardised)
Explaining the fall in coronary heart disease deaths in England & Wales 1981-2000 ? Why did CHD mortality halve in spite of population ageing?? 68,230 fewer deaths in 2000 1981 2000 Unal, Critchley & Capewell Circulation 2004 109(9) 1101
Explaining the fall in coronary heart disease deaths in England & Wales 1981-2000 • Risk Factors worse +13% • Risk Factors better -71% • Treatments -42% 68,230 fewer deaths in 2000 1981 2000 Unal, Critchley & Capewell Circulation 2004 109(9) 1101
Explaining the fall in coronary heart disease deaths in England & Wales 1981-2000 • Risk Factors worse +13% • Obesity (increase) +3.5% • Diabetes (increase) +4.8% • Physical activity (less) +4.4% • Risk Factors better -71% • Smoking -41% • Cholesterol -9% • Population BP fall -9% • Deprivation -3% • Other factors -8% • Treatments -42% • AMI treatments -8% • Secondary prevention -11% • Heart failure -12% • Angina:CABG & PTCA -4% • Angina: Aspirin etc -5% • Hypertension therapies -3% 68,230 fewer deaths in 2000 1981 2000 Unal, Critchley & Capewell Circulation 2004 109(9) 1101
Risk Factors obviously powerful but was it tablets or lifestyles??
CHD preventionin England & Wales1981-2000:Population v.High Risk StrategiesDeaths prevented or postponed(Sensitivity analysis ) Population secular trends C h o l e s t e r o l Population diet Blood Pressure Diet in CHD patients Statins CHD patients Treating High Risk Secular trends CHD patients High Risk Statins Unal et al BMJ 2005 331 614
CHD preventionin England & Wales1981-2000:Population v.High Risk StrategiesDeaths prevented or postponed(Sensitivity analysis ) Population secular trends C h o l e s t e r o l Population diet Blood Pressure Diet in CHD patients Statins CHD patients Treating High Risk Secular trends CHD patients High Risk Statins Unal et al BMJ 2005 331 614
Explaining the fall in CHD deaths in USA 1980-2000 : RESULTS NEJM 2007; 356: 2388. • Risk Factors worse +17% • Obesity (increase) +7% • Diabetes (increase) +10% • Risk Factors better -65% • Population BP fall -20% • Smoking -12% • Cholesterol (diet) -24% • Physical activity -5% • Treatments -47% • AMI treatments -10% • Secondary prevention -11% • Heart failure -9% • Angina:CABG & PTCA -5% • Hypertension therapies -7% • Statins (primary prevention) -5% • Unexplained -9% 341,745 fewer deaths in 2000 1980 2000
Comparisons with other studies: % CHD mortality falls attributed to NEJM 2007; 356: 2388.
EXPLOITING THE IMPACT MODEL • Replication in other populations • Populations with RISING CHD • Calculating life-years gained • Cost effectiveness • WHAT IF treatment uptakes increased? • WHAT IF risk factors reduced further?
WHAT IF Treatment Uptakes in England & Wales Increased?ActualUptakes 50% 25,805 Deaths prevented or postponed (DPPs)IF Uptakes at least 80% 20,910additionalDPPs Capewell et al Heart 2006 92 521 [ Capewell, Pell et al et al Eur Heart J 1999 201836 ]
IF Treatment Uptakes Increased in England & WalesActualUptakes 50% 25,805 Deaths prevented/ postponed (DPPs)IF Uptakes at least 80% 20,910additionalDPPs Capewell et al Heart 2006 92 521
EXPLOITING THE IMPACT MODEL • Replication in other populations • Populations with RISING CHD • Calculating life-years gained • Cost effectiveness • WHAT IF treatment uptakes increased? • WHAT IF risk factors reduced further?
Estimating the potential changes in CHD mortality in England & Wales between 2000 and 2010 WHAT IF risk factors a) continue recent trends ? b) undergo additional reductions ? (as already achieved in Australia, USA, Sweden, Finland etc) Unal et al J Clin Epid 2005 58 733 Kelly & Capewell HDA 2004 www
Potential changes in CHD mortality in England & Wales between 2000 and 2010IF risk factors a) continue recent trends b) additional reductions already achieved elsewhere Unal et al J Clin Epid 2005 58 733
The IMPACT Model Thus, to reduce CHD mortality in UK • Modest additional risk factor reductions already achieved in USA & Scandinavia • could prevent or postpone over 50,000 deaths by 2010 • halving current CHD deaths (100,000) in UK Unal et al J Clin Epid 2005 58 733
hence: Heart of Mersey CHD primary prevention programme Key Targets: • Healthier food • Smoking reduction
US Trends in age-adjusted CHD mortality rates: men & women aged ≥35 years Ford & Capewell JACC 2007 50 2128
US Trends in AGE-SPECIFIC CHD mortality rates: men & women aged ≥35 years Ford & Capewell JACC 2007 50 2128
Trends in age-specific CHD mortality rates England & Wales 1984-2004[lines indicate 5 year moving averages] Heart~ July 2007 doi: 10.1136/hrt.2007.118323
Using IMPACT to explain CHD trends and examine future policy optionsConclusions CHD mortality: big falls in UK & elsewhere • 25%-50% due to “evidence-based” therapies • 50% -75% due to risk factor reductions (especially smoking & cholesterol)
Using IMPACT to explain CHD trends and examine future policy optionsConclusions CHD mortality: big falls in UK & elsewhere • 25%-50% due to “evidence-based” therapies • 50% -75% due to risk factor reductions (especially smoking & cholesterol) • small reductions in UK risk factors could Halve CHD deaths • Healthy diet & Tobacco control remain top policy priorities
IMPACT Model: Main Components Blood Pressure AMI Angina Heart Failure 2' Prevention Medical Therapy RISK F FACTORS Patient Groups TREATMENTS OUTCOMES Cholesterol BMI & Diabetes Smoking Physical Activity Blood Pressure Age & Sex CABG/PTCA surgery Medical Death Survival Ford et al NEJM 2007 356 2388
Modelling UK trends to 2010 2010 predicted Unal, Critchley & Capewell Circulation 2004 109 (9) 1101; J Clin Epid 2005 58 733; Heart 2006 92 521
Modelling UK trends to 2010 predictedIF additional treatmentsper 100,000 If more treatments for more patients 21,000 fewer deaths Unal, Critchley & Capewell Circulation 2004 109 (9) 1101;Heart 2006 92 521;J Clin Epid 2005 58 733
Modelling UK trends to 2010 predictedIF additional treatmentsper 100,000 IF modest risk factor reductions Additionalrisk factor reductions 50,000 fewer deaths If more treatments for more patients 21,000 fewer deaths Unal, Critchley & Capewell Circulation 2004 109 (9) 1101;Heart 2006 92 521;J Clin Epid 2005 58 733
The Natural History of CHD Natural Course of CHD Atheroma Atheroma & Thrombosis Hanlon, Capewell et al 1997
CHD Prevention options Natural Course of CHD Hanlon, Capewell et al 1997
US Trends in AGE-SPECIFIC CHD mortality rates: men & women aged ≥35 years Ford & Capewell JACC 2007 50 2128
IMPACT2CVD Policy Model Population Policies & Behaviours Biological Risk Factors Combined CVD Risk CVD Patient Groups OUTPUTS
Population Policies & Behaviours Biological Risk Factors Combined CVD Risk CVD Patient Groups OUTPUTS SUDS NON-SUDS Chronic Angina Unstable Angina CHD Death Combined CVD Risk First MI Early Heart Failure From any State Severe Heart Failure Recurrent MI Non-CHD Death MI survivors Stroke Other CVD Populations: UK>E&W>Regions>PCTs Outputs: Population-based incidence, prevalence; Deaths prevented; Life-Years; Life expectancy; Costs; Cost-effectiveness ratios
Population Policies & Behaviours Biological Risk Factors Combined CVD Risk CVD Patient Groups OUTPUTS Diabetes or IGT SUDS NON-SUDS Physical Activity Unstable Angina Chronic Angina CHD Death Combined CVD Risk Obesity (BMI) Diet Cholesterol LDL (& HDL) Early Heart Failure Acute MI From any State Smoking Blood Pressure Severe Heart Failure Recurrent MI Non-CHD Death MI survivors Deprivation Additional CVD Risk Factors Stroke Other CVD Populations: UK>E&W>Regions>PCTs Outputs: Population-based incidence, prevalence; Deaths prevented; Life-Years; Life expectancy; Costs; Cost-effectiveness ratios
Additional risk factor reductions achieved elsewhere UK 2000 level TARGET in 2010 SMOKING 26% 17% (USA 2002) CHOLESTEROL 5.6 5.2 (mmol/l) Gothenberg (Sweden), Stanford (USA) & Perth (Australia) BLOOD PRESSURE (DiastolicBPmmHg) 77 73 (4 mmHg fall) New Zealand (4.4 ) Finland (5.2 ) & France (6.0 ) OBESITY USA: 15% prevalence reduction by 2010 (??) PHYSICAL ACTIVITY increase prevalence by 5% (?) [best] DIABETES No successful community reductions Assume 5% decrease in prevalence (??) Unal et al J Clin Epid 2005 58 733