Download
1 / 6
60 likes | 193 Vues
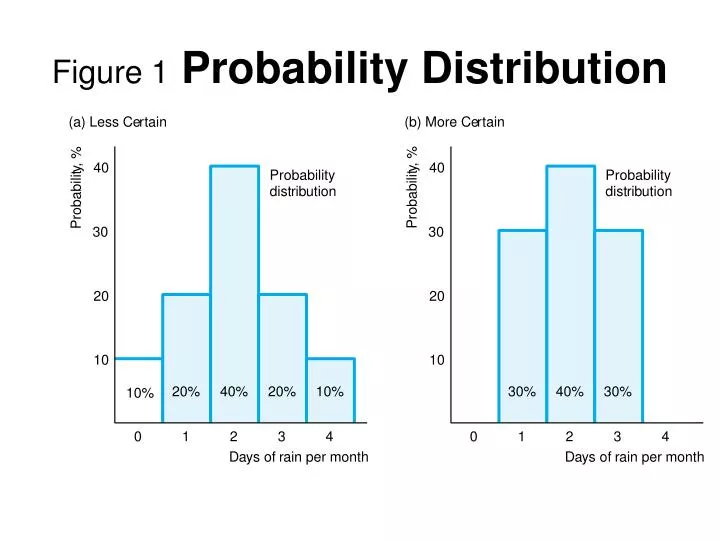
Probability. Probability. dist. r. i. b. ution. dist. r. i. b. ution. Figure 1 Probability Distribution. (a) Less Ce. r. tain. (b) More Ce. r. tain. , %. , %. 40. 40. y. y. Probabilit. Probabilit. 30. 30. 20. 20. 10. 10. 20%. 40%. 20%. 10%. 30%. 40%. 30%.

E N D
Probability Probability dist r i b ution dist r i b ution Figure 1Probability Distribution (a) Less Ce r tain (b) More Ce r tain , % , % 40 40 y y Probabilit Probabilit 30 30 20 20 10 10 20% 40% 20% 10% 30% 40% 30% 10% 0 1 2 3 4 0 1 2 3 4 D a ys of r ain per month D a ys of r ain per month
U ( W ealth) c U ($70) = 140 0.1 U ($10) + 0.9 U ($70) = 133 f d U ($40) = 120 0.5 U ($10) + 0.5 U ($70) = e U ($26) = 105 b a U ($10) = 70 ì ï í ï î Risk premium Figure 2Risk Aversion U , y Utilit 0 10 26 40 64 70 W ealth, $
Figure 4 Investment Decision Tree with Risk Aversion (cont’d)
Figure 5 Investment Decision Tree with Uncertainty and Discounting