Download
1 / 1
10 likes | 86 Vues
Large Scale Ozone Observations by UV-DIAL During INTEX-NA Marta Fenn 1 , Edward Browell 2 , Carolyn Butler 1 , John Hair 2 , Susan Kooi 1 , Syed Ismail 2 , Anthony Notari 1 , Vince Brackett 1 , Melody Avery 2

E N D
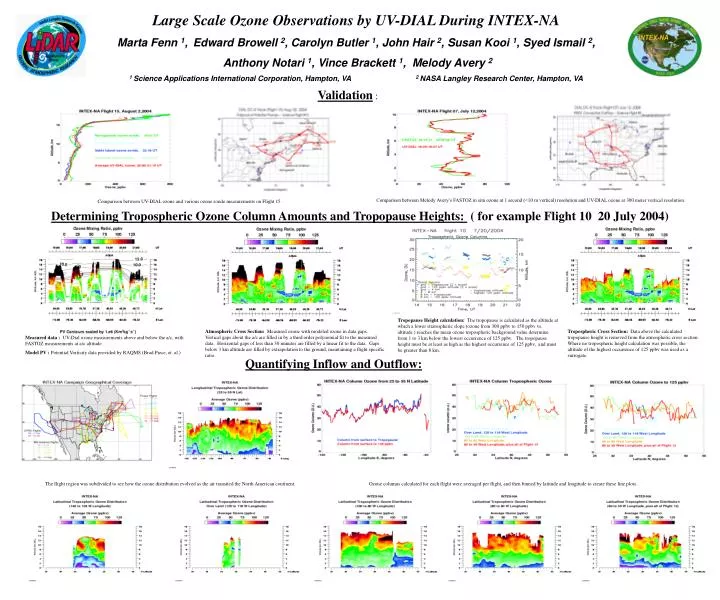
Large Scale Ozone Observations by UV-DIAL During INTEX-NA Marta Fenn 1, Edward Browell 2, Carolyn Butler 1, John Hair 2, Susan Kooi 1, Syed Ismail 2, Anthony Notari 1, Vince Brackett 1, Melody Avery 2 1 Science Applications International Corporation, Hampton, VA 2 NASA Langley Research Center, Hampton, VA Validation : Comparison between Melody Avery’s FASTOZ in situ ozone at 1 second (<10 m vertical) resolution and UV-DIAL ozone at 300 meter vertical resolution. Comparison between UV-DIAL ozone and various ozone sonde measurements on Flight 15. Determining Tropospheric Ozone Column Amounts and Tropopause Heights: ( for example Flight 10 20 July 2004) Tropopause Heightcalculation: The tropopause is calculated as the altitude at which a lower stratospheric slope (ozone from 300 ppbv to 150 ppbv vs. altitude ) reaches the mean ozone tropospheric background value determine from 1 to 3 km below the lowest occurrence of 125 ppbv. The tropopause height must be at least as high as the highest occurrence of 125 ppbv, and must be greater than 8 km. Atmospheric Cross Section: Measured ozone with modeled ozone in data gaps. Vertical gaps about the a/c are filled in by a third order polynomial fit to the measured data. Horizontal gaps of less than 30 minutes are filled by a linear fit to the data. Gaps below 3 km altitude are filled by extrapolation to the ground, maintaining a flight specific ratio. Tropospheric Cross Section: Data above the calculated tropopause height is removed from the atmospheric cross section. Where no tropospheric height calculation was possible, the altitude of the highest occurrence of 125 ppbv was used as a surrogate. Measured data : UV-Dial ozone measurements above and below the a/c, with FASTOZ measurements at a/c altitude. Model PV : Potential Vorticity data provided by RAQMS (Brad Piece, et. al.) Quantifying Inflow and Outflow: The flight region was subdivided to see how the ozone distribution evolved as the air transited the North American continent. Ozone columns calculated for each flight were averaged per flight, and then binned by latitude and longitude to create these line plots.