Download
1 / 39
450 likes | 857 Vues
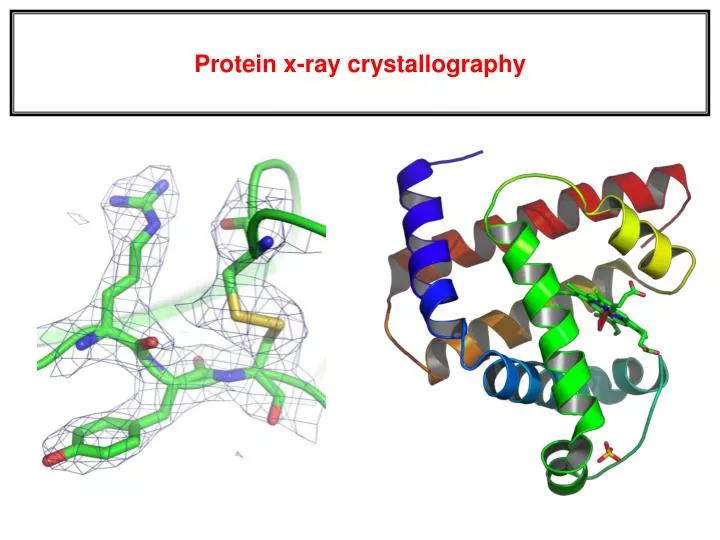
Protein x-ray crystallography. Two truths of x-ray crystallography. (1.) Models, not structures. Corroborating results suggest that the models are close to biological reality.

E N D
Two truths of x-ray crystallography (1.) Models, not structures. Corroborating results suggest that the models are close to biological reality. (2.) No matter how carefully performed, any experiment will have errors associate with it. Errors in the fitting of the (sparse) electron density maps are some of the most common.
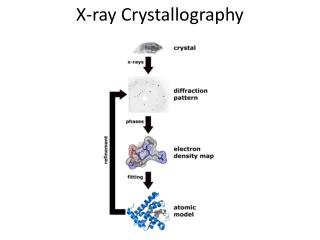
Steps in protein x-ray crystallography • Molecular biology:over-express protein in expression system. • More art than science (and more luck than art): Grow crystals of the protein that diffract well (difficult step, can take from weeks to years!). • Physics: Obtain the X-ray diffraction data. • Computation: Compute electron density maps. • Computation again: Refinement --- calculate an atomic model to fit electron density; compare the diffraction data computed from the model with the actual data; refine the model to fit the data (iterate).
Protein crystals are “liquid crystals” • Look like normal crystals, but are actually more like gels (20 to 80% solvent).
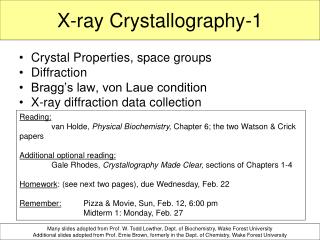
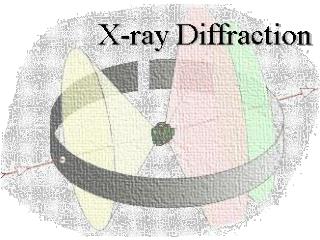
Bragg’s law explains why cleavage faces of crystals reflect x-ray beans at certain angles of incidence (diffraction) • d = spacing between molecules in the lattice • = angle of observed diffraction • = wavelength of x-rays n = integer for first order, second order, etc. 2d (sin) = n X-rays Detector Crystal
Resolution is directly proportional to q In x-ray crystallography, the phrase “2 Å model” means that the analysis included reflections out to a distance of 1/(2 Å) from the center.
Diffraction to electron density (which is not the same as the final model structure) Fourier Transform To get from the diffraction pattern to the electron density, you have to use a Fourier Transform. Note: This process is largely done automatically by a computer.
Methods to resolve the phase problem (largely outside our scope) • Isomorphous Replacement • Single Isomorphous Replacement (SIR) • Multiple Isomorphous Replacement (MIR) • Anomalous Dispersion • Single Wave-Length Anomalous Dispersion (SAD) • Multiple Wave-Length Anomalous Dispersion (MAD) • Selenomethionine is commonly used for MAD • Molecular Replacement • Direct Methods
From electron density to model Note: While some manual fitting still occurs, this process is largely done automatically by a few different computer programs.
Final models are determined from a combination of electron density overlap and MM energies Note: due to the wavelength of x-rays, hydrogen atoms are only resolved in the absolute highest resolution structures.
Key x-ray crystallography model quantities Quality: Resolution (in Å) and R-factor (values = 0 to 1). Atom coordinates: Define the mean coordinates of the (heavy) atoms. B-factors(aka, temperature factors): Describes the apparent disorder about the mean. Disorder is spatial (crystal heterogeneity) and temporal (protein flexibility). However, in reality, B-factors are in protein crystallography are NOT pure Debye-Waller factors (mobilities). Instead, B-factors are most often best characterized as “fudge factors” uses to fit the electron density maps. Occupancies: Occasionally, a better fit to the electron density can often by obtained by assuming that certain atoms can be in more than one location, due to alternate conformations.
R-factor R-factor (aka, residual factor or agreement factor) is a measure of the difference between the observed and computed intensities. Note that the structure factor F is related to intensities from the diffraction pattern. A similar quality criterion is Rfree, which is calculated from a subset (~10%) of reflections that were not included in the structure refinement. 0.6: Very bad 0.5: Bad 0.4: Recoverable 0.2: Good for Protein 0.05: Good for small organic models 0.0: Perfect ||Fobs| - |Fcalc|| R = ------------------ |Fobs| R values:
Common rules of thumb A good rule of thumb for defining an acceptability threshold is based on resolution and R-factor. A resolution of 2.0 Å or lower and a R-factor of 0.20 or lower is a commonly used threshold in structural bioinformatic analyses. It is important to remember though, that there is no such thing as a single structure. Proteins are best described by ensembles. In the past, NMR structures were considered to be of lower quality than x-ray structures. However, they are increasingly accepted, especially since the environmental conditions (solvent vs. liquid crystal) have been argued to be more biological. Unfortunately, there is no magic number that can be used to assess NMR structure quality, or lack thereof.
Common methods for model evaluation (you will cover this more in Dr. Guo’s class)
Model evaluation via MM force fields (you will cover this more in Dr. Guo’s class)
For more info on x-ray crystallography I strongly recommend this book to anyone doing structural bioinformatics!
A few comments about protein structure determination via NMR (HSCQ + others)
Introduction of a magnetic field will orient the random spins along the external field
The extent of the chemical shift is related to local environment (e.g. chemical shifts in 1H NMR)
Chemical shifts Chemical shifts are determined relative to a reference state --- frequently tetramethalsilane (TMS). TMS is great for several reasons... (1.) Twelve chemically equivalent protons means lots-o-signal (2.) Electronegativity of Silicon << electronegativity of Carbon, thus signal shouldn’t effect things. (3.) Low boiling point, so can be easily removed via heating.
Q: What is the output of multidimensional protein NMR experiment? Distance restraints, angle restraints, and orientation restraints. Distance comes from HSQC’s (NOESY, etc.). A series of protein structure models is built that attempt to satisfy as many of the restraints as possible, in addition to general properties of proteins such as bond lengths and angles. The algorithms convert the restraints and the general protein properties into energy terms, and thus tries to minimize the energy. The process results in an ensemble of structures that, if the data were sufficient to dictate a certain fold, will converge.
Q: What is the output of multidimensional protein NMR experiment? Answer: A series of models that satisfy the experimental constraints, while still obeying the chemical rules that govern protein structure (as we understand it). Also: While other NMR experiments do directly quantify flexibility through NMR order parameters (i.e., S2), which is beyond the scope of this class, NMR protein structures do not directly quantify flexibility. Nevertheless, regions where models vary is frequently used to indirectly identify flexible regions.
Sometimes NMR spectra are informative even when they can’t be resolved Heteronuclear single quantum correlation
Other methods to determine macromolecular structure: Examples from (cryo)-electron microscopy
Other methods to determine macromolecular structure: Small Angle X-Ray Scattering (SAXS)