Download
1 / 64
640 likes | 801 Vues
Maritime transport planning: - Optimization Perintis - Potential for cost reduction in inter-island container transport. ADB TA8045 (Phase 2) “Improving Domestic Connectivity”. Robert Verhaeghe (TUDelft) Fitri Indriastiwi (Litbang MoT). 20 oct 2014. CONTENT. Review:

E N D
Maritime transport planning: - Optimization Perintis - Potential for cost reduction in inter-island container transport ADB TA8045 (Phase 2)“Improving Domestic Connectivity” Robert Verhaeghe (TUDelft) Fitri Indriastiwi (Litbang MoT) 20 oct 2014
CONTENT • Review: • use of criteria (effectiveness of transport system, financial, economic, social) for evaluation of transport, • estimation of impacts for those categories • Illustration of the use of modelling for planning of • Perintis transport • Inter-island container transport • Conclusions – follow up • Potential of the approach • Expansions in view of current transport policy questions
Effectiveness of the transport system • Example Perintis: • provide the transport service in the most effective way fulfilling the demand for transport (frequency of service, minimum transport time), • with the best input of ships and combination of ship tours
Financial impacts • Example Perintis: • Standpoint of provider/sponsor • Cost for providing the service • Revenue from the service for a particular price setting • Cash balance: need for subsidy? • Standpoint of user • cost of the service
Economic impacts • Total effect of an improvement of transport on the welfare of the country/region • Improved transport has a direct effect on some sectors of the economy but these effects propagate into related sectors • Macro-economics has a modelling approach for this: Input-Output (I-O) modelling • To include regional differences and transport a special version of I-O is available which includes trade between regions : a spatial I-O (Spatial Computable General Equilibrium model SCGE)
Economic impacts • In macro-economics transport costs are called transaction costs; reduced costs improve trade and economic performance • Problem: how well can the activities be supported by Perintis (small businesses, local) be included in the SCGE?Little data on those activities; how well are they represented in the modeling? Region B Trade Region A Transaction costs associated with transport
Social impacts • Most difficult to determine and estimate; not included in economic modelling • Basically the analysis of how Perintis improves the lifes of people should be carried out at the micro-level • Which standard of minimal service frequency should be provided? • When can a transition be made to commercial service? • An ability to pay analysis could indicate if commercial service can be afforded. • However the remoteness of the place also a plays role because transport to such place maybe very expensive due to low load. • Conclusion: evaluating/justifying transport subsidy to low income users and/or a disadvantaged part of the network is difficult (universal problem)
Quantification: challenge for transport planning • Ability to quantify the functioning of the transport system and the impacts is necessary to compare alternatives • In the present presentation focus is on quantification (modelling) to enable an assessment of transport effectiveness and financial impacts • Applications • Subsidized Perintis service • Commercial inter-island container transport
2) Illustration of the use of modelling in transport planning (Perintis, Inter-island container transport)
Transport analysis: supply - demand employment … social trade Value generated Demand for transport Transport market: equilibrium/performance Implementation cost Supply of transport facilities … transport modes vehicle fleet(s) infrastructure
ADB TA8045: analysis framework Spreadsheets Demographic/ economic models Survey + secondary data Projection of economic activity Transport model (Omnitrans) Demand for transport (O-D matrix) Spreadsheets/ Matlab Performance of transport system (revenue, ….) Match of supply and demand Transport supply system (infra, routes,…) Design of improvements to the transport system Cost analysis (life-cycle) Base map (GIS) Mapinfo, Arcinfo Spreadsheets
Components of the framework • Demand estimation/monitoring: analysis of monitoring data, design and execution of a survey • Modelling: implementation of the Omnitrans transport analysis software including training • Cost analysis: derivation of life-cycle cost for shipping • Design of improvements to the Perintis service: Maluku case study
AMBON GESER GORAM/ONDOR Example: schematization of R-31 P. KESUI P. TIOR KAIMEAR P. KUR P. TOYANDO PANGKALAN AMBON TRAYEK R-31 Ambon -184- Geser -32- Gorom / Ondor -32- P. Kesui -17- P. Tior -36- Kaimer -12- P. Kur -28- P. Toyando -33- Tual -118- Dobo -118- Tual -33- P. Toyando -28- P. Kur -12- Kaimer -47- P. Tior -17- P. Kesui -32- Gorom / Ondor -32- Geser -184- Ambon -184- Geser -32- Gorom / Ondor -158- Tual -160- Dobo -132- Ambon JARAK : 1.661 MIL FREKUENSI : 19 VOYAGE LAMA PELY. : 19 HARI UKURAN KPL : 500 DWT/GT.325 KPA : Adpel Ambon Kontraktor : PT. Pelayaran Dharma Indah Domisili : Ambon Nama Kapal : KM. Cantika Pratama 02 Kontrak : 3.265.634.925 N.O.R : 04 Pebruari 2012 TUAL DOBO
Data preparation …. Schematization transport system Links of the network (characteristics: distance, price,……) Port dwell time AMBON GESER Transit line defining the route (characteristics: frequency, ship characteristics, ….) GORAM/ONDOR Length Velocity ….. P. KESUI P. TIOR KAIMEAR P. KUR P. TOYANDO PANGKALAN AMBON TRAYEK R-31 Ambon -184- Geser -32- Gorom / Ondor -32- P. Kesui -17- P. Tior -36- Kaimer -12- P. Kur -28- P. Toyando -33- Tual -118- Dobo -118- Tual -33- P. Toyando -28- P. Kur -12- Kaimer -47- P. Tior -17- P. Kesui -32- Gorom / Ondor -32- Geser -184- Ambon -184- Geser -32- Gorom / Ondor -158- Tual -160- Dobo -132- Ambon JARAK : 1.661 MIL FREKUENSI : 19 VOYAGE LAMA PELY. : 19 HARI UKURAN KPL : 500 DWT/GT325 KPA : Adpel Ambon Kontraktor : PT. Pelayaran Dharma Indah Domisili : Ambon Nama Kapal : KM. Cantika Pratama 02 Kontrak : 3.265.634.925 N.O.R : 04 Pebruari 2012 TUAL DOBO
Results from modeling • Shortest route from Tual to Manokwari
Results from modeling Connection of Sorong with the region : demand (O-D passengers and freight)
Results from modeling • Network performance: for example: trip time distribution
Results from modeling • Time to reach a larger place (services): for example access to Ambon or Tual or Saumlaki for Maluku region
Locations to be connected (Maluku) 47 ports Ambon Tual Base ports Saumlaki
Criteria for design of the transport service • Accessibility or Connectivity? • Connectivity is usually used in the context of the economy: economists think about how the economy is connected and performing; better connection means less transaction costs and better economic performance • Accessibility is usually used in the context of transport: a transport engineer/economist thinks in terms of improving the transport service; how well can a certain place be reached using the available transport facilities • Basically the two concepts relate to the some thing in a different context • Typical formulation
Criteria for design of the transport service • Typical formulation of Accessibility • Usually a gravity type expression is used • The availability of public services can be considered proportional to the size of the population of a particular site. The accessibility of a site i will be proportional to the size of the population centers in the neighborhood and inverse proportional to distance to reach those centers. Further of importance is the frequency by which the connection is provided, a higher frequency results in a higher accessibility. Ai : accessibility Dij : distance to reach j from i Pj : population in j Fj : frequency by which the connection form j to i is provided m : nodes (population centers) in the network connected to i Dij : shortest route to reach j from iwith available transport (provided by Omnitrans) • Typical formulation
Set up of Maluku case • Accessibility index: only relative indicator; gives overall impression of the differences in region, where most action is needed; not sufficient/detailed enough to make new design of the transport service • Present approach: comparison existing situation with a new design using 5 more detailed criteria (elaborated below) • Using rational concepts/judgement (reduced length of tours, avoid overlap, hub and spoke,…) a new set of 11 tours has been defined; this is compared with the existing situation (15 routes) using the 5 criteria
SORONG EXISTING SITUATION (15 ROUTES) R38 R38 AMBON R34 R40 R35 R44 POMAKO R36 R43 TUAL R37 R45 R39 R42 BIRINGKASI Bebar/Wulur R46 R41 REO SAUMLAKI Luang Kisar/Wonreli Moa Lakor Lelang R47 R48
SORONG AFTER RE-ROUTING (11 ROUTES) R38a AMBON R40a R34a POMAKO R999 R37a R43a R35a TUAL BIRINGKASI R41a R44a R46a REO SAUMLAKI R47a
Criterion 3: number of visits - effectiveness Total number of visits 7460 Total number of visits 4910 Existing 15 routes New 11 routes
Criterion 4: life-cycle cost • Reduced number (4) of ships : saving 40 bln Rp/year
Criterion 5: passenger.miles – consumer cost • Passenger miles: • Existing : 29 mln • 11 route : 21 mln • Reduction consumer cost with 11 route: 1,5 bln Rp/year
Evaluation summary • Criteria 1: travel time distribution is the same • Criteria 2 : slight improvement of the access time • Criteria 3: • existing situation: very large variation of visits among the different ports • new route service: visits more equally distributed among ports but overall a reduced number of visits to ports • Criteria 4: • the overall cost for the ship operator/sponsor is the following: 40 blnRp/year (cost savings) – 1.5 (reduced revenue because more efficient travel) = 38,5 blnRp (cost saving) • Criteria 5: reduced consumer cost : 1,5 blnRp/year (cost saving) • The new 11 route system represents a win-win proposal for operator/sponsor and consumer
Evaluation summary (cont) • Observation: visit to most ports is about 1 per week • Socially acceptable? • If visitation needs to be higher then this will increase the cost ; trade-off between social standard and cost
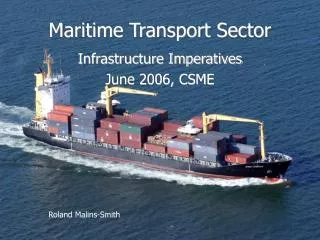
Analysis inter-island container transport(how to reduce high transport/logistic cost?)
Existing container transport service (some characteristics) • Statistics on shipping service based on DGST data (2009) • Wide range of ship sizes • Load factor
Existing container transport service (some characteristics) • Current cost container shipment: example • Pontianak to Tg Priok : 600 $/TEU • China to Tg Priok : 400 $/TEU • Imbalance between Inbound and Outbound flow (Java): examples • What is the prospect for reducing transport cost?
Role of scale effects in maritime transport • Globalization is driven by developments in maritime transport (world-wide: 90% of total ton.km) : scale effect, logistics harmonization in corridors • Transport and Communication Costs Indexes, 1920-2000;
Role of scale effects in maritime transport • To which extent can such scale effects be realized on the Indonesian network? What is needed to realize them? • The following analyses have been carried out to find out: • Preparation of container transport cost model (variables: demand volume, distance, ship size, load factor, logistic efficiency) • Analysis of options for the national network (using transport model)
Illustration scale effect (using cost model) Demand: 100 TEU/day Demand: 100 TEU/day
Optimal shipping size • Optimum defined by : marginal cost for shipping = marginal cost for inventory Distance: 3000 km Demand: 100 TEU/day Time value: 50 $/TEU.day Optimum size: 700 TEU
What are the prospects for reduction of domestic container transport cost? Analysis approach • We like to know what is possible in 2030 • Pro-active planning of improvements to shipping and network, and increased demand by 2030 • Set-up: • Demand projection for 2030 • Design of supply system for 2030 • Matching demand-supply
Pro-active planning container transport 2030 • Domestic Network (26 strategic ports) Potential for International flow or • Demand projection: • Use is made of projection by [Indii, 2012]: demand 2030 = 5.4 * demand 2009