Download

1 / 14
140 likes | 256 Vues
The Median-Median Line. Lesson 3.4. Have you noticed that you and your classmates frequently find different equations to model the same data?. The median-median line is one of the simplest methods.

E N D
The Median-Median Line Lesson 3.4
Have you noticed that you and your classmates frequently find different equations to model the same data? The median-median line is one of the simplest methods. The procedure for finding the median-median line uses three points M1, M2, and M3 to represent the entire data set, and the equation that best fits these three points is taken as the line of fit for the entire set of data.
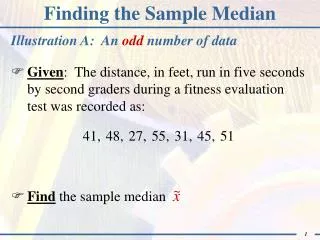
To find the three points that will represent the entire data set, you first order all the data points by their domain value (the x-value) and then divide the data into three equal groups. If the number of points is not divisible by 3, then you split them so that the first and last groups are the same size. For example: 18 data points: split into groups of 6-6-6 19 data points: split into groups of 6-7-6 20 data points: split into groups of 7-6-7
You then order the y-values within each of the groups. The representative point for each group has the coordinates of the median x-value of that group and the median y-value of that group. Because a good line of fit divides the data evenly, the median-median line should pass between M1, M2, and M3, but be closer to M1 and M3 because they represent two-thirds of the data. To accomplish this, you can find the y-intercept of the line through M1 and M3, and the y-intercept of the line through M2 that has the same slope. The mean of the three y-intercepts of the lines through M1, M2, and M3 gives you the y-intercept of a line that satisfies these requirements.
Example • Find the median-median line for these data.
The Median-Median Line • The median-median line is parallel to both of these lines, so it will also have a slope of 5.082. To find the y-intercept of the median-median line, you find the mean of the y-intercepts of the lines through M1, M2, and M3. • Since there is one line that passes through M1 and M2, the y-intercept for these lines are both -0.475. The y-intercept of the line through M3 is 0.795. • The mean of the y-intercepts is • So the equation of the median-median line is
Finding a Median-Median Line • Order your data by domain value first. Then, divide the data into three sets equal in size. If the number of points does not divide evenly into three groups, make sure that the first and last groups are the same size. Find the median x-value and the median y-value in each group. Call these points M1, M2, and M3. • Find the slope of the line through M1 and M3. This is the slope of the median-median line. • Find the equation of the line through M1 with the slope you found in Step 2. The equation of the line through M3 will be the same. • Find the equation of the line through M2 with the slope you found in Step 2. • Find the y-intercept of the median-median line by taking the mean of the y-intercepts of the lines through M1, M2, and M3. The y-intercepts of the lines through M1 and M3 are the same. • Finally, write the equation of the median-median line using the mean y-intercept from Step 5 and the slope from Step 2.
Airline Schedules • In this investigation you will use data about airline flights to find a median-median line to model the relationship between the distance of a flight and the flight time. You will use the linear model to make predictions about flight times and distances that aren’t in the table. • The flights listed here are morning departures from Detroit, Michigan. Write a complete sentence explaining what the first line of data tells you.
Graph the data on graph paper. • Show the steps to calculate the median-median line through the data. Write the equation of this line. Use your calculator to check your work.
64 67 104 229 306 610 (67, 306) 120 156 180 189 658 938 1129 1092 (168, 1033.5) 248 288 303 1671 1979 2079 (288, 1979)
On your graph, mark the three representative points used in the median-median process. Add the line to this graph.
Answer these questions about your data and model. a. Use your median-median line to interpolate two points for which you did not collect data. What is the real-world meaning of each of these points? b. Which two points differ the most from the value predicted by your equation? Explain why. c. What is the real-world meaning of your slope? d. Find the y-intercept of your median-median line. What is its real-world meaning? e. What are the domain and range for your data? Why? f. Compare the median-median line method to the method you used in Lesson 3.3 to find the line of fit. What are the advantages and disadvantages of each? In your opinion, which method produces a better line of fit? Why?