Download
1 / 1
10 likes | 91 Vues
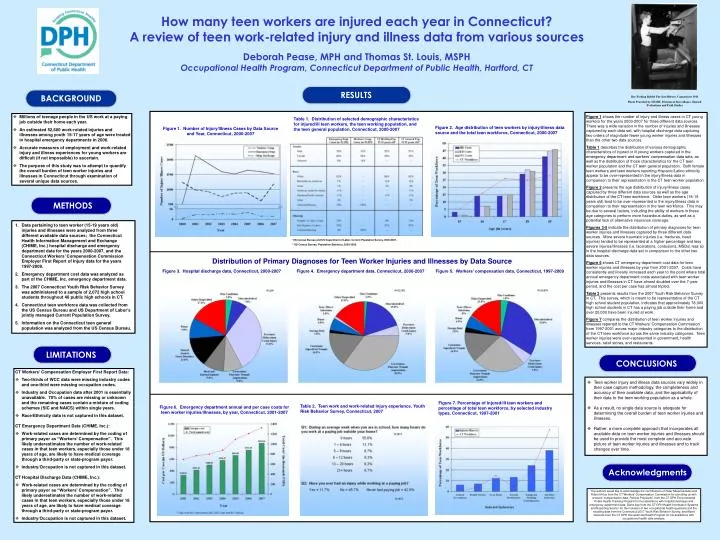
METHODS. Acknowledgments. LIMITATIONS. How many teen workers are injured each year in Connecticut? A review of teen work-related injury and illness data from various sources Deborah Pease, MPH and Thomas St. Louis, MSPH

E N D
METHODS Acknowledgments LIMITATIONS How many teen workers are injured each year in Connecticut? A review of teen work-related injury and illness data from various sources Deborah Pease, MPH and Thomas St. Louis, MSPH Occupational Health Program, Connecticut Department of Public Health, Hartford, CT RESULTS BACKGROUND Boy Feeding Rabbit Fur Into Blower, Connecticut 1941 Photo Provided by NIOSH, Division of Surveillance, Hazard Evaluations and Field Studies RESULTS • Millions of teenage people in the US work at a paying job outside their home each year. • An estimated 52,600 work-related injuries and illnesses among youth 15-17 years of age were treated in hospital emergency departments in 2006. • Accurate measures of employment and work-related injury and illness experiences for young workers are difficult (if not impossible) to ascertain. • The purpose of this study was to attempt to quantify the overall burden of teen worker injuries and illnesses in Connecticut through examination of several unique data sources. Figure 1 shows the number of injury and illness cases in CT young workers for the years 2000-2007 for three different data sources. There was a wide variation in the number of injuries and illnesses captured by each data set, with hospital discharge data capturing two orders of magnitude fewer young worker injuries and illnesses than the other two data sources. Table 1 describes the distribution of various demographic characteristics of injured or ill young workers captured in the emergency department and workers’ compensation data sets, as well as the distribution of those characteristics for the CT teen worker population and the CT teen general population. Both female teen workers and teen workers reporting Hispanic/Latino ethnicity appear to be over-represented in the injury/illness data in comparison to their representation in the CT teen worker population. Figure 2 presents the age distribution of injury/illness cases captured by three different data sources as well as the age distribution of the CT teen workforce. Older teen workers (18-19 years old) tend to be over-represented in the injury/illness data in comparison to their representation in the teen workforce. This may be due to several factors, including the ability of workers in these age categories to perform more hazardous duties, as well as a potential lack of alternative insurance coverage. Figures 3-5 indicate the distribution of primary diagnoses for teen worker injuries and illnesses captured by three different data sources. More severe traumatic injuries (i.e. fractures, head injuries) tended to be represented at a higher percentage and less severe injuries/illnesses (i.e. lacerations, contusions, MSDs) less so in the hospital discharge data set in comparison to the other two data sources. Figure 6 shows CT emergency department cost data for teen worker injuries and illnesses by year from 2001-2007. Costs have consistently and linearly increased each year to the point where total annual emergency department costs associated with teen worker injuries and illnesses in CT have almost doubled over the 7-year period, and the cost per case has almost tripled. Table 2 presents results from the 2007 Youth Risk Behavior Survey in CT. This survey, which is meant to be representative of the CT high school student population, indicates that approximately 78,000 high school students in CT has a paying job outside their home and over 20,000 have been injured at work. Figure 7 compares the distribution of teen worker injuries and illnesses reported to the CT Workers’ Compensation Commission from 1997-2001 across major industry categories to the distribution of the CT teen workforce across the same industry categories. Teen worker injuries were over-represented in government, health services, retail stores, and restaurants. Table 1. Distribution of selected demographic characteristics for injured/ill teen workers, the teen working population, and the teen general population, Connecticut, 2000-2007 Figure 2. Age distribution of teen workers by injury/illness data source and the total teen workforce, Connecticut, 2000-2007 Figure 1. Number of Injury/Illness Cases by Data Source and Year, Connecticut, 2000-2007 BACKGROUND Data pertaining to teen worker (15-19 years old) injuries and illnesses were analyzed from three different available data sources; the Connecticut Health Information Management and Exchange (CHIME, Inc.) hospital discharge and emergency department data for the years 2000-2007, and the Connecticut Workers’ Compensation Commission Employer First Report of Injury data for the years 1997-2009. Emergency department cost data was analyzed as part of the CHIME, Inc. emergency department data. The 2007 Connecticut Youth Risk Behavior Survey was administered to a sample of 2,072 high school students throughout 46 public high schools in CT. Connecticut teen workforce data was collected from the US Census Bureau and US Department of Labor’s jointly managed Current Population Survey. Information on the Connecticut teen general population was analyzed from the US Census Bureau. * US Census Bureau and US Department of Labor, Current Population Survey, 2000-2007. ** US Census Bureau, Population Statistics, 2000-2008. Distribution of Primary Diagnoses for Teen Worker Injuries and Illnesses by Data Source Figure 3.Hospital discharge data, Connecticut, 2000-2007 Figure 4. Emergency department data, Connecticut, 2000-2007 Figure 5. Workers’ compensation data, Connecticut, 1997-2009 CONCLUSIONS CT Workers’ Compensation Employer First Report Data: • Two-thirds of WCC data were missing industry codes and one-third were missing occupation codes. • Industry and Occupation data after 2001 is essentially unavailable. 70% of cases are missing or unknown and the remaining cases contain a mixture of coding schemes (SIC and NAICS) within single years. • Race/Ethnicity data is not captured in this dataset. CT Emergency Department Data (CHIME, Inc.): • Work-related cases are determined by the coding of primary payor as “Workers’ Compensation”. This likely underestimates the number of work-related cases in that teen workers, especially those under 18 years of age, are likely to have medical coverage through a third-party or state-program payor. • Industry/Occupation is not captured in this dataset. CT Hospital Discharge Data (CHIME, Inc.): • Work-related cases are determined by the coding of primary payor as “Workers’ Compensation”. This likely underestimates the number of work-related cases in that teen workers, especially those under 18 years of age, are likely to have medical coverage through a third-party or state-program payor. • Industry/Occupation is not captured in this dataset. • Teen worker injury and illness data sources vary widely in their case capture methodology, the completeness and accuracy of their available data, and the applicability of their data to the teen working population as a whole. • As a result, no single data source is adequate for determining the overall burden of teen worker injuries and illnesses. • Rather, a more complete approach that incorporates all available data on teen worker injuries and illnesses should be used to provide the most complete and accurate picture of teen worker injuries and illnesses and to track changes over time. Figure 7. Percentage of injured/ill teen workers and percentage of total teen workforce, by selected industry types, Connecticut, 1997-2001 Table 2. Teen work and work-related injury experience, Youth Risk Behavior Survey, Connecticut, 2007 Figure 6. Emergency department annual and per case costs for teen worker injuries/illnesses, by year, Connecticut, 2001-2007 The authors would like to acknowledge the contributions of Peter Miecznikowski and Robert Artus from the CT Workers’ Compensation Commission for providing us with workers’ compensation data, Patricia Przysiecki, from the CT DPH Environmental Public Health Tracking Program for her assistance with hospital discharge and emergency department data, Diane Aye from the CT DPH Health Information Systems and Reporting Section for the inclusion of two occupational health questions and the resulting data from the Connecticut 2007 Youth Risk Behavior Survey, and Albert Deloreto from the CT DPH Occupational Health Program for his assistance with occupational health data analysis.