Download
1 / 11
110 likes | 223 Vues
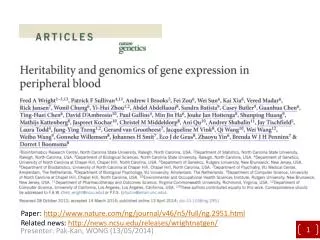
Population genomics of human gene expression. Anders Långberg Carolina Håkanson BIMM53. A study of how different population varies in their gene expression Epstein Barr transformed lymphoblastoid cell lines 4’000’000 SNP’s from 270 individuals from 4 HapMap populations. The aim:.

E N D
Population genomics of human gene expression Anders Långberg Carolina Håkanson BIMM53
A study of how different population varies in their gene expression • Epstein Barr transformed lymphoblastoid cell lines • 4’000’000 SNP’s from 270 individuals from 4 HapMap populations
The aim: • Insight into variabel gene expression • Cis- and trans acting regulatory elements • Shared functional genetic effects between populations
Abbreveations • CEU – Caucasian European • CHB – Chinese Beijing University • JPT – Japanease from Tokyo • YRI – Yoruba from Ibadan, Nigeria • Pooling of cell lines in different combinations
Methods • Pooling of cell lines • Normalization • Quantile across the four replicates • Median Normalization • To prove the relevance of the following experiments they proformed a heritability estimation for expression phenotypes • After a comparison of the populations gene expression, genes that differ more than 16% were chosen • To verify these results they performed a second array, not related to the first – high correlation was shown
Linear regression model • A way to look at correlation between two sample series • Each series plotted on each axis.
Spearman Rank Correlation • Another way to look at correlation between series • Special case of Pearson
Methods Cis-Assocation between SNP variation and expression variation • SNP’s (HapMap PII) 1Mbp upstream and downstream from probe midpoint • gene expression and SNP’s were regression analysed • Determining the significance of the regression p-value 10’000 permutations were preformed of the data independetly for each gene • Analysed in depth those associations significant at the 0.001 permutation threshold • Single populations as well as pooled population (CEU-CHB-JPT) (CHB-JPT) (CEU-CHB-JPT-YRI)
Significant associated SNP’s to genes show a trend to be positioned close to TSS. • A significant amount of SNP’s found in promoter and coding sequence regions of genes.
Same study as preformed for cis reulated was preformed on trans acting elements • Results not to conclusive? – due to unspecificity of trans-acting elemnts