Download
1 / 42
430 likes | 512 Vues
DATABASE DESIGN. ERD. E ntity R elational D iagram ( ERD ) Visual display of tables and their relationships for a database

E N D
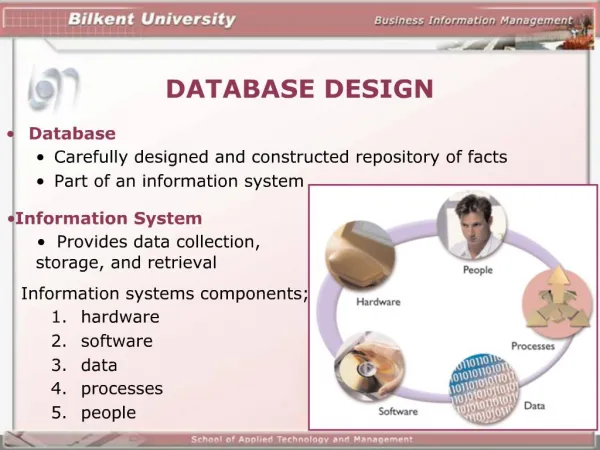
ERD • Entity Relational Diagram (ERD) • Visual display of tables and their relationships for a database • Used for “Relational Modeling”
ERD cont. • SQUARESindicate TABLES • LINESbetween them indicate the different relationships • “FEET” at end of line, indicates a “MANY” relationship • -1CUSTOMER has MANY “receipts” • -1STAFF MEMBER sells MANY“receipts” • -1PRODUCTcan go into many different “receipts” • Each product has to be INDIVIDUALLYlisted
ERD cont. • IFI wanted to know whosold me the order, I have to go to the receipt (order ) , in the “RECEIPT”table, I’ll find who the STAFF MEMBER is who sold me that receipt • IFI wanted to know what product a CUSTOMER has ordered, I have to go to the receipt (order ), in the “PRODUCT” table • -NO DIRECT relationship BETWEEN : • CUSTOMER& STAFF, or • CUSTOMER & PRODUCT
What are Tables or Entities • Used to represent thingsin the “real world” that is of significant interest to the user • i.e. “EMPLOYEES” might be an “Entity” in a company database • NOUNS in a “Business Narrative” • each tableis called an “entity” and the columns are referred to as an “attribute”. • within a table , each rowis called a “record” and it represents 1particular instanceof its “entity” (not unlike the flat file). Employees
Entities Continued • Another example: • A database regarding music • Artist & Song are both tables • “Performs”is the relationship (VERB) (usually is a “supporting document” which explains the relationship)
Entities and Their Attributes • “Entities” represent something of importance • “Entities” are made up of several “Attributes” (the columns), which describe the tables:
Entities Summarized • Each ENTITY is made up of rows and columns • Columns are called fields or attributes of a database • Rows are called records or an instance of an entity • If you have repetitiveVALUESto 1attribute, —create a: “JOINER TABLE” or “LOOKUP TABLE” • make this attribute a “Foreign” key • Create another table withsame attribute • i.e. a: “Shoe Table” with “colours” • “Colours”will be a “Foreign” key, here: with “ColourID” • primary key in a new table called: colours, with “ColourID” • 8-10attributesperTABLE, after that create anothertable
Entities Summarized cont. • OR:When a table has the SAME VALUEREPETITIVELY for that attribute, you might need a “LOOKUP TABLE”: • People might misspell, the value, then you can’t do a: SEARCH • i.e. LEVEL OF EDUCATION • “Masters” • What if 1 person spells it: “Masters” • Another person “Master” • Another person Masters of Education • You will have multiple occurences of 1VALUE which takes up too much space in your database
Steps in Database Design • Complete a “Needs Assessment” (note: this is a huge process that is not covered in this course) • Basically, you speak with end users, managers, existing documents and think “outside the box” • If, in the design of the database, there is multiple occurrences of data (think of our “gender” example) this is an indicator that another table should be created. • Create a “Business Narrative” • Identify entities • Identify attributes & keys • Identify relationships
Business Narrative • Vital link between database designer and the end users • Purpose is to make clear the “data requirements” • The story, business rules, purposes of database; what kind of info it will hold • Will have to go over the DESIGN multiple times/days to make sure the DESIGN is correct • Get other people/users to comment on design • Example: • “Algonquin college employs many instructors to deliver various programs comprised of many different courses. “
Starting an ERD • Identify the “entities” • Look at NOUNSof the “Business Narrative” “Algonquin college employs many instructorsto deliver various programs comprised of many different courses.” programs instructors courses
When the list of Entities Seems Complete • Ask about each “entity”: • Is it significant? • List only entities that are important to your databaseusers and that are worth the trouble and expense of computer tabulation. • Is it generic? • List only types of things, notindividual instances • “EMPLOYEES”, “INSTRUCTORS” are generic of many different instances—we don’t say “Joe” • Is it fundamental? • List only entities that exist independently and do not need something else to explain them. • “Courses”-explains itself, you don’t need further elaboration
Three Basic Types of Relationships • One to One (1:1) • One to Many (1:M) • Many to Many (M:M) • The 1 is the “PARENT”, and the M is the “CHILD” • Called the CARDINALITY of the relationship • The cardinality indicates the MAXIMUM number of RELATIONSHIPS between the entities, • Whenever you see: “MANY”—this will be the FOREIGN KEY
One to One Relationships • 1:1 relationships exists when a single record in one table has 1 and only 1corresponding record in anothertable, and vice versa • VERY RARE • When you created a table for something, when it really should only have been a “field” • The 1should really have been an “attribute” of the other (table/entity) an attributeIMPROPERLY DEFINED as an entity • i.e. 1customer,1address • “Address” should have been the attribute of the “Customer” table
One to One Example • A voter can cast only one vote in an election. • A ballot paper can belong to only one voter. • So there will be a 1:1relationship between a Voter and a Ballot Paper. Voter Ballot
One to Many Relationships • MOST COMMON • 1:M or M:1 • Relationship exists when a record can relate to 1OR MORE records in a 2nd table but.. • A record in the 2nd table can ONLY relate to 1record in the 1sttable
One to Many Example • A person can own more than one car. A car can only have one owner. Owner Vehicle
Many to Many Relationships • M:M • Relationship exists when 1record in eithertable can relate to more than 1record in the othertable • These should be eliminated • 2 related “PARENT”tables, but their relationship is NOT “direct” • Instead, it needs to be related through an additional “CHILD” table
Many to Many Example • A student can have more than one professor; the same professor can have many students • http://www.youtube.com/watch?v=0lSLI7q-hVE Student Professor
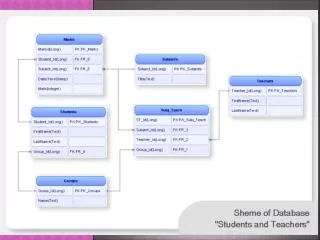
Resolving Many to Many • M:M is not allowed, as an attribute could have more than 1value: • A “Multi-Valued Attribute” • Difficult to generate reports, or do searches • Would have to repeat attributesmultiple times • Instead, we create a “JUNCTION” or “JOINER ENTITY” • The name of the joiner entity is often a COMBINATION of the 2 entities Student Stud_Prof Professor
Resolving Many to Many Relationships ByCreating A Junction Or Joiner Entity • http://www.youtube.com/watch?v=NvrpuBAMddw
SHEETS OF ICE • 1 arena with many sheets • ARENA ID-primary key in ARENA table • Add a FOREIGN KEY to SHEETS OF ICE (AREN_AID) • Can a sheets of ice belong to many arenas? NO—so we know it’s a one-to-many • TEAMS table-PRIMARY KEY: TEAM ID to PLAYERS table FOREIGN KEY: TEAM ID
Normalization • Refining the ERD • Task of analyzing entities and the relationships created have been formalized into a process called normalization. • Should resolve all your relationships to One to Many (1:M)relationships • Eliminate all One to One’s (1:1) and Many to Many’s(M:M)
Sample Business Narrative • CD Collection example • I have many cd’s by various artists. I like all types of music
Sample Business Narrative • Courses example: • A course can have many different learning objectives and each learning objective has various examples and a method of testing.
Sample Business Narrative • New Home Builders example: • Bamarack is a builder of new homes in the Ottawa area. They subcontract all the work that needs to be completed for the build of a new home. Each subcontractor has a specialized trade.
We Build a Business Narrative • Create a business narrative for your shoe collection at home
Attributes for Our Shoe Scenario • Identify the attributes for all entities identified for our shoe inventory database
Selecting Attributes • Attributes are the fields/columns that describe an entity • Attributes can be: • A Characteristic • A Quality • A Feature • A Fact • An attribute is a “non-decomposable” piece of information about an entity • Can’t be broken down any further, only 1 single value per column • i.e. NAME—last name, 1st name • Attribute “Naming Conventions” • Single word (or more than 1 word with an underscore(no spaces) • Unique • Can’t be a reserved word” • i.e. “Number”, “Date” ( these are date types), OR name of column can’t be same as name oftable
Attributes • Identify the entity and attributes for the following business narrative: • ABC Property Management Inc has a building with 20 units. Some are rented, some are vacant. Some are 1 bedroom, some are 2 bedrooms. The rent varies. ABC Property Management Inc keeps track of the tenant and lease information
ONLY WATCH UNTIL 5minutes 31 seconds (until it mentions: “QUERYSMITH”) • http://www.youtube.com/watch?v=Y-bvjtYgRVU
REMOVE SORT • HOMEtab, in the SORT & FILTERgroup, click the REMOVE SORTbutton:
FILTER BY SELECTION in a “TABLE” • HOME > SORT & FILTER group > click on the FILTER icon > • To FILTER: • Click on the drop-down arrow on the COLUMN HEADING (field) you want to filter • Select or de-select the VALUES you want to filter
NUMBER FILTERS • Click on the drop-down arrow on the COLUMN HEADING (field) you want to filter • NUMBER FILTERS > select one of this options: • When you select “Less Than” or • “Greater Than”, by default it will • Also contain “Equal To”, so key in • The next number UP (for GREATER than), or The next number DOWN(for LESS than) • I.E. If you want >200, you would have to key in >201 (as it contains “equal to”, and will flag “200” also)
FILTER BY FORM • SORT & FILTER group • ADVANCED button • FILTER BY FORM
FILTER BY SELECTION in a “QUERY” • To filter all the rows in a table that contain a value that matches a selectedvalue in a row • Right-click the VALUE you want to filter. > select: “EQUALS” the specific value you want • IF A FILTER IS ALREADY APPLIED: • HOMEtab,> SORT & FILTER group, > Advanced, > click: CLEAR ALL FILTERS.
ADDING A “TOTAL” ROW IN A QUERY • QUERY TOOLS DESIGN tab, > SHOW/HIDE group, click the TOTALS button • In the TOTALrowbelow the AMOUNT field, click the drop-down arrow and select: MIN. • DESIGNtab, > RESULTSgroup, > RUNbutton. • VIEW the query in DESIGN view
HYBRID: MYITLAB • MYITLAB HOMEWORK: • myitlabTRAINING: Access VOLUME 1- “Skill-Based TRAINING” • myitlabASSIGNMENT: • “EXPLORING series” • Access Chapter 1- GRADER PROJECT [HOMEWORK]